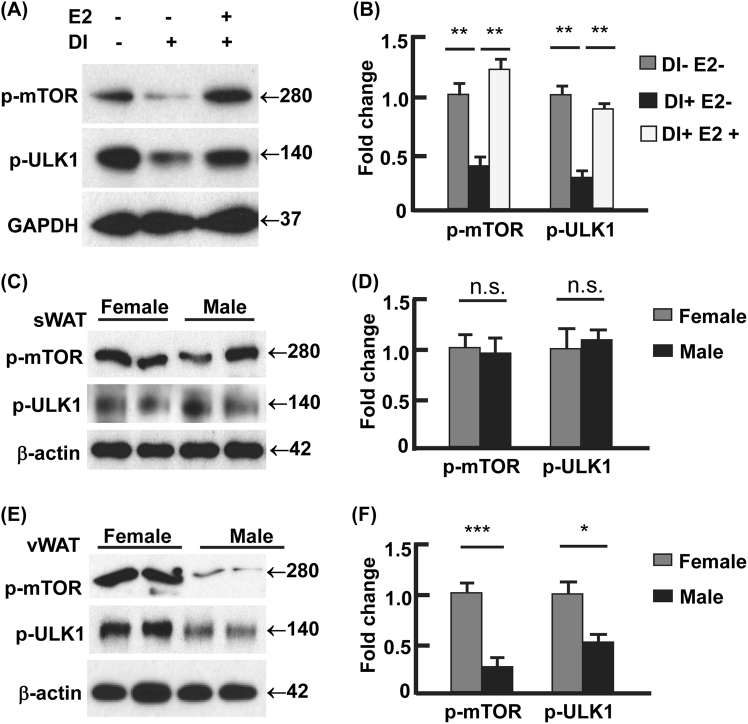
Fig. 6. Estradiol-ER signaling regulated autophagy via mTOR-ULK1 pathway.
a, b E2 (0.1 μM, days 0–12) induced the activating phosphorylation of mTOR (Ser2448) and the mTOR-catalyzed inhibitory phosphorylation of ULK1 (Ser757), analyzed by Western blotting (a) and densitometry (b). DI+ represents 3T3L1 cells with differentiation induction and harvested on day 12, and DI− represents 3T3L1 cells without differentiation and harvested on day 12. c, d The females and males showed comparable phosphorylation of mTOR (Ser2448) and ULK1 (Ser757), analyzed by Western blotting (c) and densitometry (d). e, f The females showed significantly stronger phosphorylation of mTOR (Ser2448) and ULK1 (Ser757) than the males, analyzed by Western blotting (e) and densitometry (f). In densitometric analysis, the band densities of investigated proteins were normalized against that of GAPDH or β-actin, and the fold changes were calculated by taking the normalized density of DI-E2- group (a and b) or female group (c–f) as “1”. *p < 0.05; **p < 0.01; ***p < 0.0001; n.s. not significant; n = 3–4

