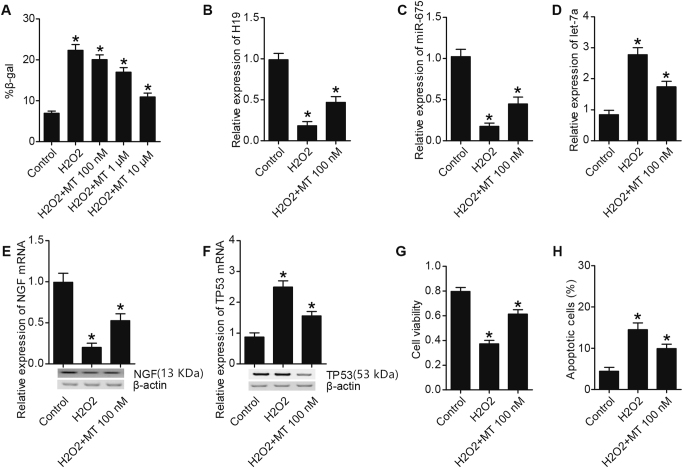
Fig. 4. MT regulated cell apoptosis, H19, miR-675, let-7a, TP53, NGF levels in U251 cells (*P < 0.05 compared with the control).
a H2O2 treatment increased number of SA-b-gal, which was restored by 1 and 10 μm of MT administration. b H19 level in H2O2 treatment group was much lower than H2O2 plus MT treatment group; both of them were much lower than control. c miR-675 level in H2O2 plus MT treatment group was much lower than control, and was even lower in H2O2 treatment group. d let-7a level in H2O2 treatment group was much higher than H2O2 plus MT treatment group; both of them were much higher than control. e NGF level in H2O2 plus MT treatment group was much lower than control, and was even lower in H2O2 treatment group. f TP53 level in H2O2 treatment group was much higher than H2O2 plus MT treatment group; both of them were much higher than control. g Treating with H2O2 or H2O2 plus MT inhibited proliferation of U251 cell, but the inhibition effect of H2O2 was much stronger than H2O2 plus MT. h Treating with H2O2 or H2O2 plus MT promoted apoptosis of U251 cell, but the promotion effect of H2O2 was much stronger than H2O2 plus MT

