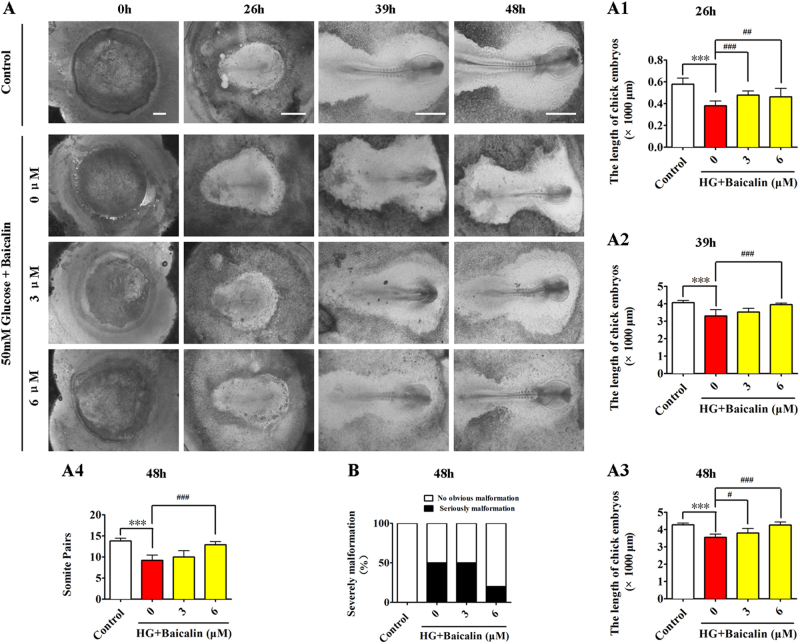
Fig. 2. The assessment of gastrula chick embryo development in the absence/presence of HG and Baicalin.
a The representative bright-field images were taken from control (first row), 50 mM glucose + 0 μM Baicalin (second row), 50 mM glucose+3 μM Baicalin (third row) and 50 mM glucose+6 μM Baicalin (fourth row) groups at incubation times of 0, 26, 39 and 48 h, respectively. a1–a4Bar charts showing the comparison of chick embryo length at 26 h (a1), 39 h (a2), 48 h (a3) and somite pair numbers at 48 h (a4) in the absence/presence of 50 mM glucose+various concentrations of Baicalin. b Bar chart showing the comparison of severely abnormal chick embryo percentages in the absence/presence of various concentrations of Baicalin. HG high glucose. ***p<0.001 compared with control group; #p<0.05 compared with HG group; ##p<0.01 compared with HG group; ###p<0.001 compared with HG group. Scale bars = 1000 µm in (a)

