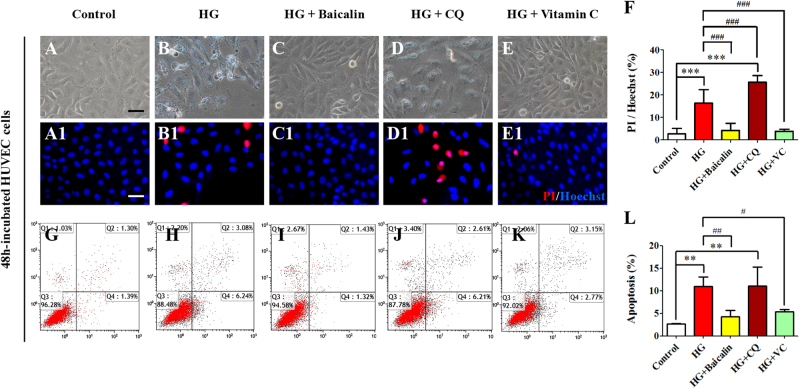
Fig. 8. The apoptosis assessment of HUVECs in the absence/presence of HG and Baicalin, chloroquine or Vitamin C.
a–e The representative bright-field images of 48-h cultured HUVECs from control (a), 50 mM glucose (b), 6 μM Baicalin+50 mM glucose (c), 10 μM chloroquine (CQ)+50 mM glucose (d) and 40 μM Vitamin C+50 mM glucose (e) group. a1–e1 The fluorescent staining of PI and Hoechst was implemented on 48-h cultured HUVECs as in (a–e), respectively. f Bar chart showing the ratio comparison between PI+ and Hoechst+ HUVECs in each group. g–k The PI flow cytometric assay was implemented in mentioned-above groups. l The bar chart showing the comparison of the values of Q2 (late apoptosis)+Q4 (early apoptosis) in the cultured HUVECs among mentioned-above groups. **p<0.01 compared with control group; ***p<0.001 compared with control group; #p<0.05 compared with HG group; ##p<0.01 compared with HG group; ###p<0.001 compared with HG group. Scale bars = 100 µm in (a–e) and (a1–e1)

