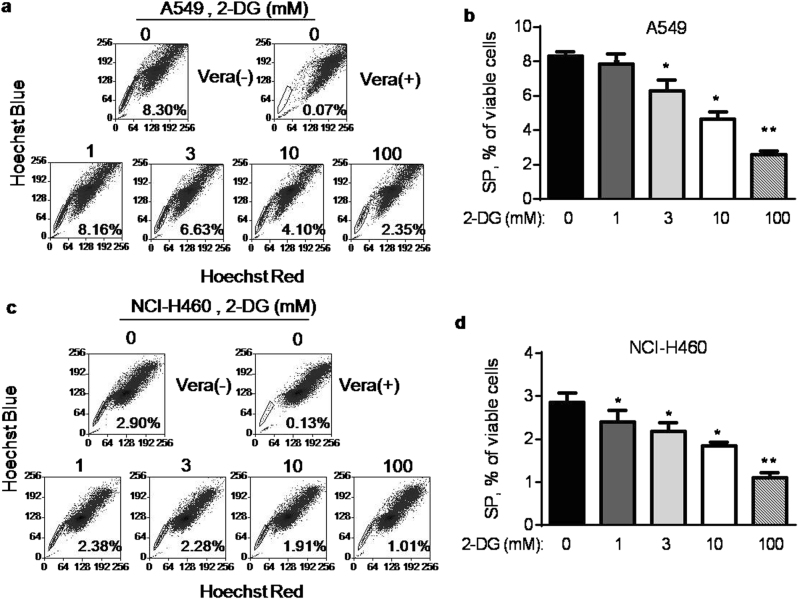
Fig. 5. Effect of 2-deoxyglucose on SP cells in vitro.
a A549 cells were treated with the indicated concentrations of 2-deoxyglucose (2-DG) for 24 h, stained with Hoechst 33342 for 90 min, and then analyzed for SP by flow cytometry. b Quantitative data of three separate experiments described in a. Each bar represents mean ± SD, *p < 0.05; **p < 0.01. c NCI-H460 cells were treated with the indicated concentrations of 2-DG for 24 h, stained with Hoechst 33342, and then analyzed for SP by flow cytometry. The number within each panel shows the percentage of SP cells. d Quantitative data of three separate experiments described in c Each bar represents mean ± SD of three separate measurements, *p < 0.05; **p < 0.01

