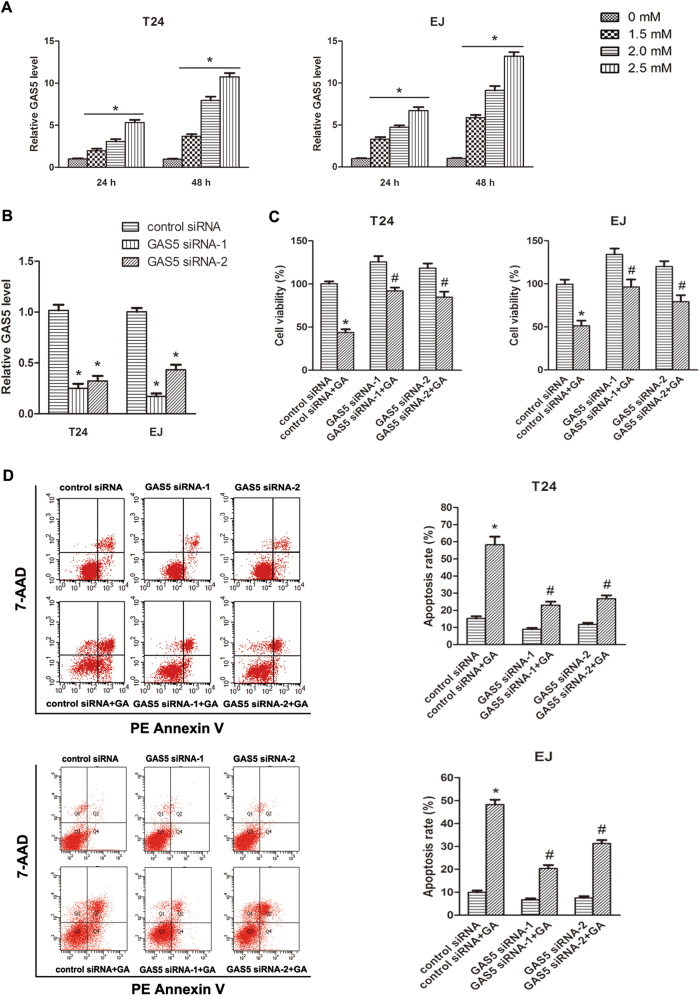
Fig. 2. GA enhanced GAS5 expression, and knockdown of GAS5 suppressed GA-induced apoptosis of BC cells.
a T24 and EJ cells were treated with different concentrations of GA (0, 1.5, 2, 2.5 μM) for 24 or 48 h, and GAS5 expression levels were assessed by RT-qPCR. b The expression levels of GAS5 in T24 and EJ cells were detected by RT-qPCR assay, with transfection of GAS5 siRNA-1, -2 or the control siRNA for 48 h. c Forty eight hour after transfection of siRNAs, 2.5 μM GA or isopyknic PBS was treated. Twenty four hour later, cells were collected and cell viabilities were evaluated by MTT assay. d Meanwhile, cell apoptosis rates were analyzed by flow cytometry analyzed. Results were presented as the means ± SD of triplicates. *P < 0.05 versus control groups, #a significant difference between GAS5 siRNA and control siRNA groups

