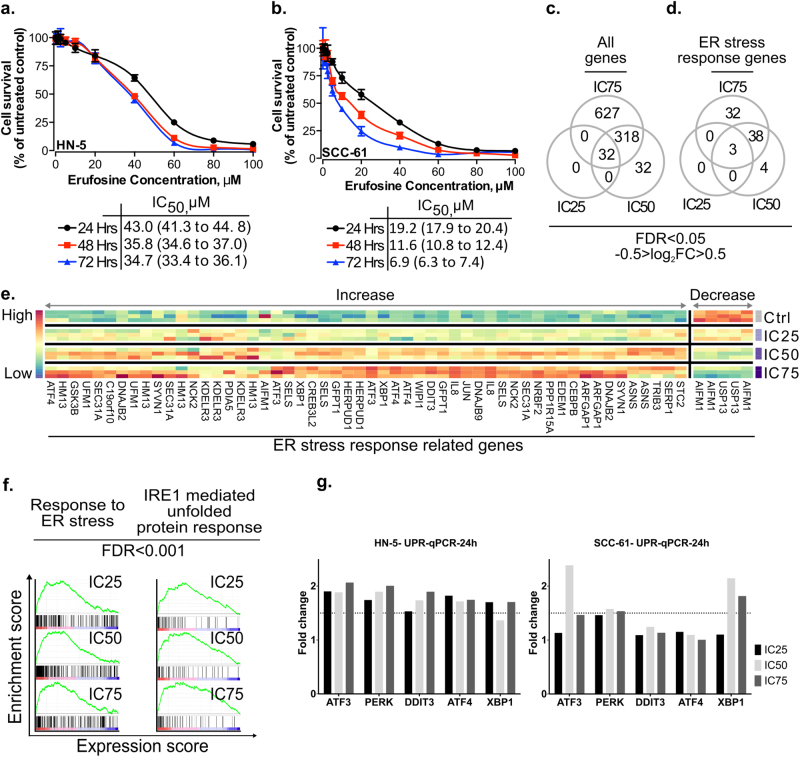
Fig. 1. Cytotoxic concentrations of erufosine induce ER stress in HN5 and SCC61 cells.
Cytotoxic effect of erufosine in OSCC cell lines HN-5 (a) and SCC-61 (b) as determined by MTT assay at 24, 48, and 72 h post treatment. The respective IC50 values are given below the graph. c Overlap among all genes (c) and ER stress-response genes (d), which are differentially expressed upon erufosine exposure at IC25, IC50, and IC75 concentrations. e Heat map of differentially expressed ER stress-response genes for at least two different concentrations of erufosine. (f) Positively correlated enrichment of ER stress-related pathways and transcription factors in erufosine-treated HN-5 cells (g) qRT-PCR verification of ER stress genes viz. PERK, ATF3, ATF4, DDIT3, and XPB1, which were upregulated from the microarray data in HN-5 cells post erufosine exposure. Fold changes are depicted as averages of triplicate experiments. The dotted line represents a 1.5-fold change in expression, beyond which a significant change in expression was assumed.

