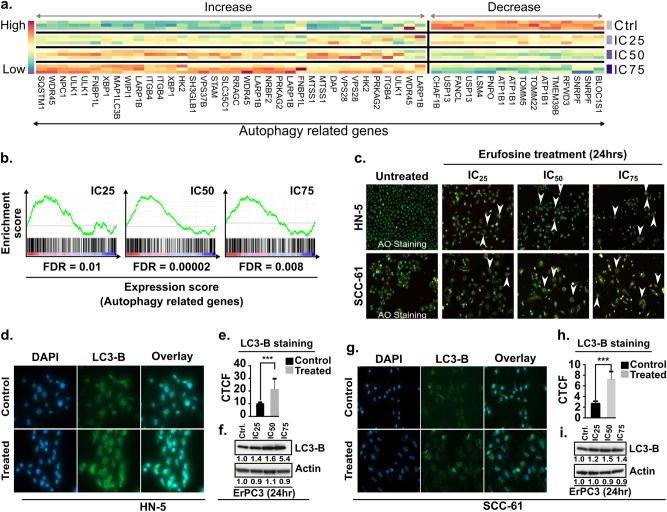
Fig. 4. Induction of autophagy by erufosine exposure.
a Heat map of the differentially expressed autophagy-related genes in response to erufosine at IC25, IC50, and IC75 concentrations in HN-5 cells. b The positive enrichment of autophagy-related genes upon erufosine exposure in HN-5 cells, with the FDR being a maximum of 0.01. c Acridine orange staining of HN-5 and SCC-61 cells exposed to increasing concentrations of erufosine shows accumulation of acidic vacuoles (AVOs) post 24 h as indicated by white arrow heads. No such AVOs can be seen in the untreated control cells. d, g Immunofluorescence staining of LC3B-II levels in HN-5 and SCC-61 cells showed increased intensity in erufosine-treated samples when compared to the control cells. A significant increase in the CTCF levels was seen (e, h) in the two cell lines, when treated with the respective IC50 concentration for each of the cell lines (p < 0.005). Western blot analysis of LC3B-II expression in HN-5 and SCC-61 cells (f, i) showed a dose-dependent increase of LC3-B-II protein levels post 24 h of exposure. β-Actin was used as loading standard. All protein bands were related to their respective control set to unity and corrected by the relative intensity of the loading control by using the densitometry function in Image J.

