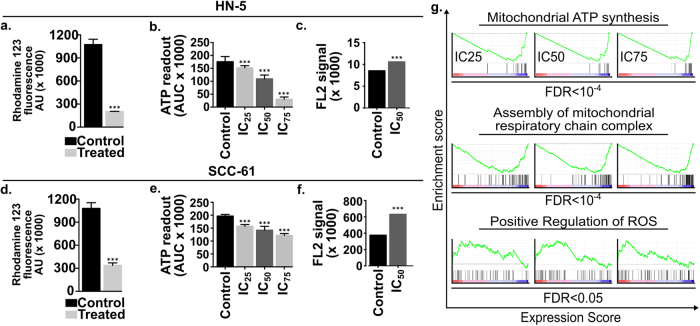
Fig. 6. Dysregulation of mitochondria upon erufosine exposure.
a Measurement of mitochondrial membrane potential (Δψm) with rhodamine in OSCC cells. The IC50 concentration of erufosine was used for both cell lines and fluorescence intensity was measured post 24 h. A significant decrease in the fluorescence intensity was seen in response to exposure (p < 0.001). b Measurement of ATP production in OSCC cell lines. The luminescence assay was used to measure the ATP levels post 24 h of erufosine treatment in HN-5 and SCC-6 cells. A significant decrease (**p < 0.05) (***p < 0.005) was seen in the two cell lines. c ROS measurement in HN-5 and SCC-61 cells post 24 h of erufosine treatment. An increase in the AUC of the DCF-DA fluorescence signal peak was seen in erufosine-treated cells when compared to the control cells. g Negative enrichment of the mitochondrial ATP synthesis and assembly of mitochondrial respiratory chain complex was seen at IC25, IC50, and IC75 concentration of erufosine, whereas a positive regulation of ROS was observed upon erufosine exposure at the three concentrations of erufosine in HN-5 cells.

