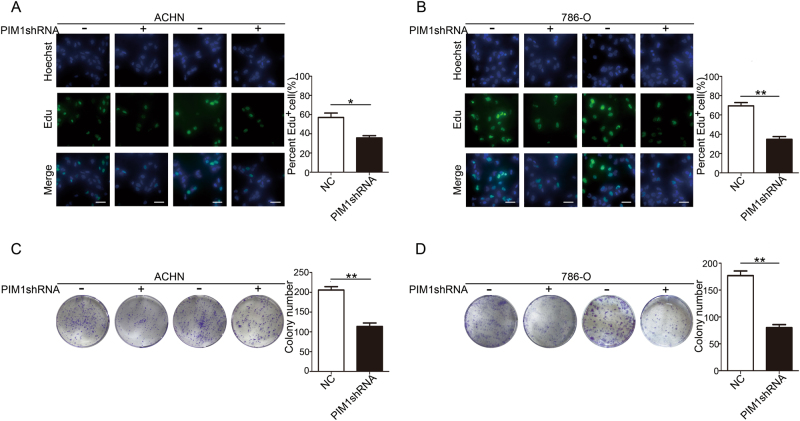
Fig. 2. Knockdown of PIM1 suppresses the growth of ccRCC cells in vitro.
a, b Edu assays. The cells were stained with Edu (green) and a nuclear dye, Hoechst (blue). Edu-positive cells were counted with ImageJ software, and the percentage of positive cells was calculated. Scale bar: 20 μm. c, d Colony formation assays. The number of colonies were quantified with ImageJ software. Data are shown as the mean ± S.E.M. of the values from triplicate experiments. Statistical significance was assessed with a two-tailed Student’s t-test. *P < 0.05; and **P < 0.01

