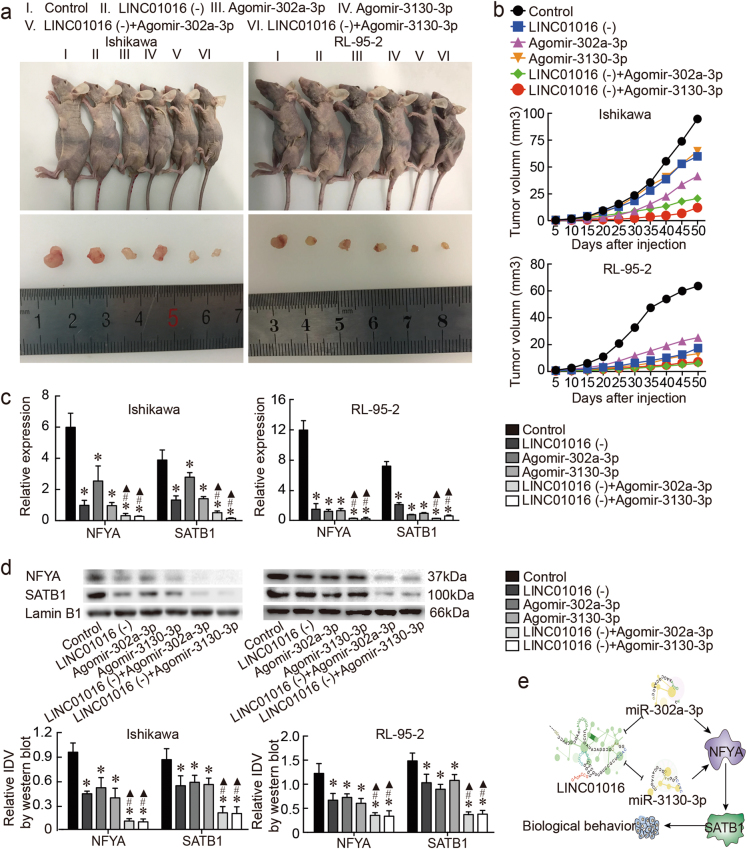
Fig. 7. In vivo study of tumor xenografts.
a Nude mice harboring tumors, and a specimen from each respective group, are shown. b Tumor widths and lengths were determined and tumor volume was calculated for each animal at 5-day intervals after injection, in total 10 times. c, d NFYA and SATB1 expression levels as determined by qRT-PCR and western blot in tumor tissues obtained from each group. e The proposed negative feedback loop mechanism underlying the LINC01016-miR-302a-3p/miR-3130-3p/NFYA/SATB1 axis in Ishikawa and RL-95-2 cells. Data are presented as the means ± SD from three independent experiments. *P < 0.05

