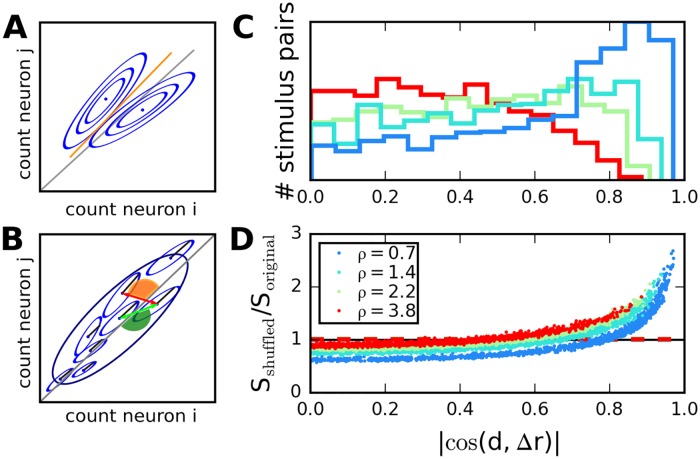
Fig 4. Covariances affect stimulus discriminability.
A: Sketch of response distributions for two neurons and two stimuli (blue ellipses). Neural responses are correlated for both stimuli, so that main axis of variability is nearly parallel to linear separator (orange line). B: Larger ensemble of stimuli for correlated neurons (large variance along diagonal directions). The effect of correlations is favorable for stimulus pairs for which difference in means is orthogonal to diagonal (red arrow), and unfavorable when difference in means is nearly parallel to diagonal (green arrow). C: Distribution of cosines of angle between diagonal and difference in means, across stimulus pairs in recurrent networks with different parameter ρ. In networks with low ρ, unfavorable angles are more frequent. D: Ratio between discriminability for correlated and shuffled distributions, dots correspond to stimulus pairs. Values smaller than one correspond to beneficial correlations. Dashed horizontal lines indicate averages across all stimulus pairs.

