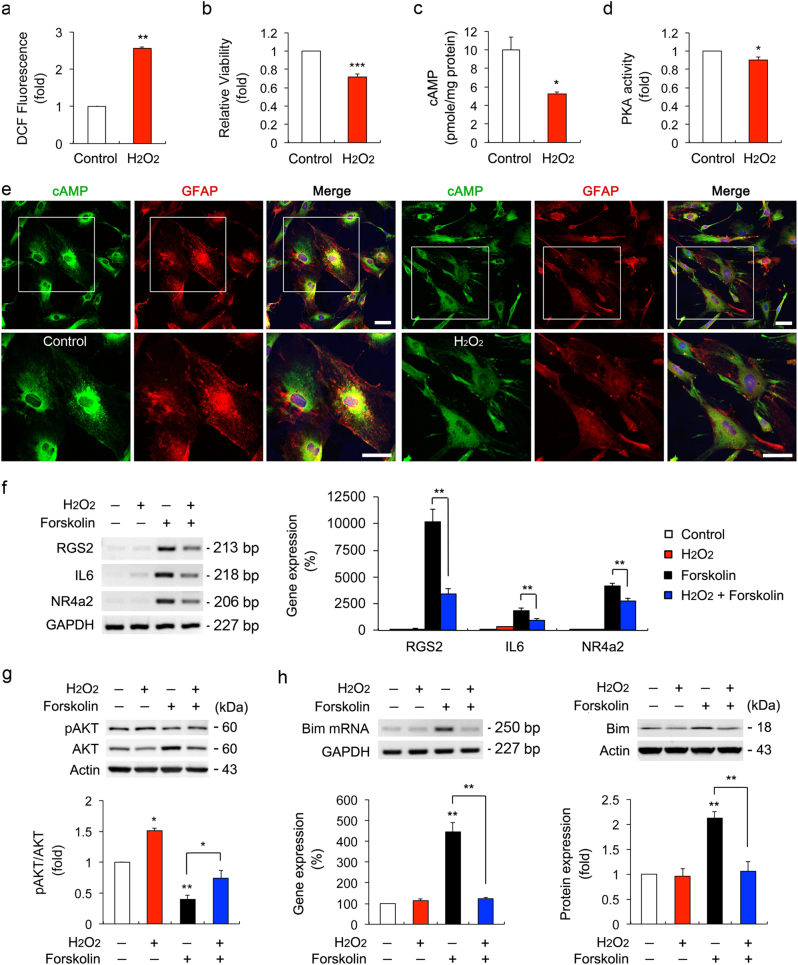
Fig. 7. Effects of oxidative stress on cAMP/PKA signaling pathway in ONH astrocytes.
a ROS production in ONH astrocytes treated with H2O2 (50 μM) for 1 h. b Cell viability analysis using MTT assay in ONH astrocytes treated with H2O2 (50 μM) for 1 h. c Intracellular cAMP measurement in ONH astrocytes treated with H2O2 (50 μM) for 1 h. d PKA activity measurement in ONH astrocytes treated with H2O2 (50 μM) for 1 h. For each determination, the ROS, cell viability, PKA activity and mRNA expression in controls was normalized to a value of 1.0 and the cAMP level was normalized to the protein contents. e Immunocytochemical analyses of cAMP and GFAP in ONH astrocytes treated with H2O2 (50 μM) for 1 h. Representative images showed a decrease of cAMP immunoreactivity in H2O2-treated ONH astrocytes. Note that decreased level of cAMP in the cytoplasm of ONH astrocytes treated with H2O2 (50 μM). Scale bars, 20 µm. f Real-time RT-PCR analysis of PKA target genes in ONH astrocytes treated with H2O2 (50 μM) and/or forskolin (10 μM) for 1 h. Data were normalized by GAPDH expression. g Immunoblot analyses of pAKT and total AKT in ONH astrocytes treated with H2O2 (50 μM) and/or forskolin (10 μM) for 1 h. For each determination, the ratio of pAKT/total AKT protein level in control cells with no treatment was normalized to a value of 1.0. h Real-time RT-PCR and immunoblot analyses of Bim in ONH astrocytes treated with H2O2 (50 μM) and/or forskolin (10 μM) for 1 h. Data were normalized by GAPDH and Actin expression, respectively. For each determination, the mRNA and protein expression in controls was normalized to a value of 100% or 1.0. Data are shown as the mean ± S.D. (n = 3). *P < 0.05; **P < 0.01; ***P < 0.001 (two-tailed unpaired Student’s t-test)

