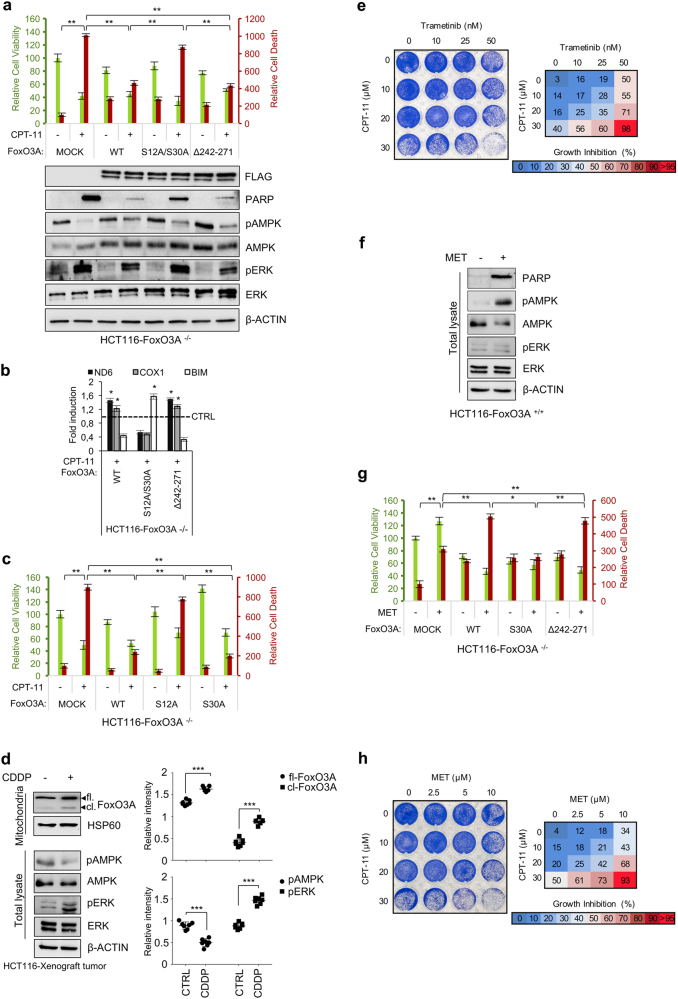
Fig. 7. mtFoxO3A is involved in cancer cell response to chemotherapeutic agents.
a–c HCT116-FoxO3A−/− cells were transfected with the indicated plasmids for 48 h and then treated with irinotecan (CPT-11, 30 μM, 24 h). a Upper panel: relative cell viability and relative cell death. Lower panel: immunoblot analysis of total proteins. β-actin: loading control. b Transcription analysis of selected mitochondrial (ND6 and COX1) and nuclear (BIM) genes by RT-PCR. c HCT116-FoxO3A−/− cells were transfected with the indicated plasmids for 48 h and then treated with irinotecan (CPT-11, 30 μM, 24 h). Relative cell viability and relative cell death were calculated. d Left panel: immunoblot analysis of total and mitochondrial proteins isolated from tumors (n ≥ 7 for each group) derived from HCT116-xenografted nude mice subjected to cisplatin treatment (CDDP, 2 mg/kg, 6 days). β-actin and HSP60 were used as total lysate and mitochondrial fraction controls, respectively. Right panel: densitometric analysis of full-length and cleaved FoxO3A normalized against the mitochondrial fractionation loading control and the results of the densitometric analysis of the phosphorylated forms of AMPK and ERK normalized against total AMPK and ERK, respectively, and the loading control. e Clonogenic assay on HCT116-FoxO3A+/+ cells treated with increasing concentrations of trametinib (24 h) and/or irinotecan (24 h), as indicated. f Immunoblot analysis of total proteins isolated from HCT116-FoxO3A+/+ cells upon metformin treatment (MET, 10 μM, 72 h). β-actin: loading control. g HCT116-FoxO3A−/− cells were transfected with the indicated plasmids for 48 h and then treated with metformin (MET, 10 μM, 72 h). Relative cell viability and relative cell death were calculated. h Clonogenic assay on HCT116-FoxO3A+/+ cells treated with increasing concentrations of metformin (24 h) and/or irinotecan (24 h), as indicated. e, h Cell growth percent inhibition at each drug concentration is presented. The data presented are the mean of at least three independent experiments. Where applicable, data are presented as mean ± SEM and significance was calculated with Student’s t test; *p < 0.05, **p < 0.01, and ***p < 0.001

