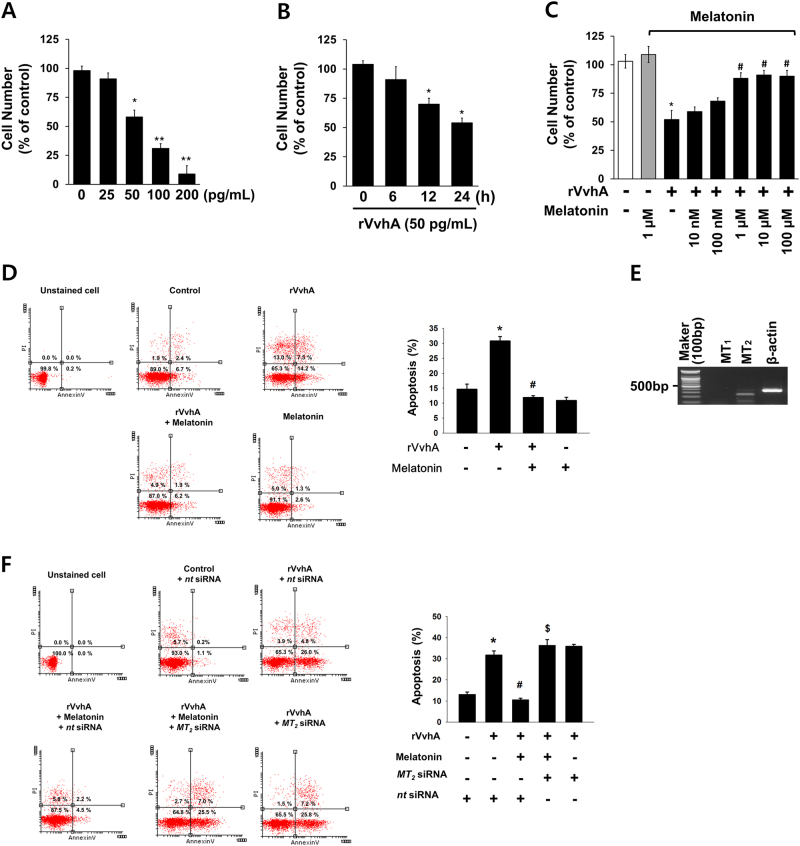
Fig. 1. Melatonin prevents apoptosis induced by VvhA via MT2.
a Dose responses of rVvhA for 24 h in cell counting assay are shown. Data represent means ± S.E. n = 5. *p < 0.05 vs. 0 pg/mL. **P < 0.01 vs. 0 pg/mL. b Time responses of 50 pg/mL of rVvhA in cell counting assay are shown. Error bars represent the means ± S.E. n = 5. *p < 0.01 vs. 0 h. c Cells were treated with melatonin at various concentrations (10–100 µM) for 30 min prior to rVvhA (50 pg/mL) exposure for 24 h. *p < 0.01 vs. vehicle. #p < 0.01 vs. rVvhA alone. d Cells were incubated with melatonin (1 µM) for 30 min prior to rVvhA exposure for 24 h. Percentages of total apoptotic cells were measured by using Annexin V/PI staining and flow cytometry. n = 4. *p < 0.01 vs. control. #p < 0.01 vs. rVvhA alone. e Expression of MT1 and MT2 mRNAs in HCT116 cells. A representative 1% agarose gel following RT–PCR is shown. n = 3. f Cells transfected with siRNAs for non-targeting (nt) control and MT2 were incubated with melatonin (1 µM) for 30 min prior to rVvhA exposure for 24 h. Percentages of total apoptotic cells were measured by using Annexin V/PI staining and flow cytometry. n = 4. *p < 0.01 vs. nt siRNA alone. #p < 0.01 vs. rVvhA + nt siRNA. $p < 0.01 vs. rVvhA + melatonin + nt siRNA

