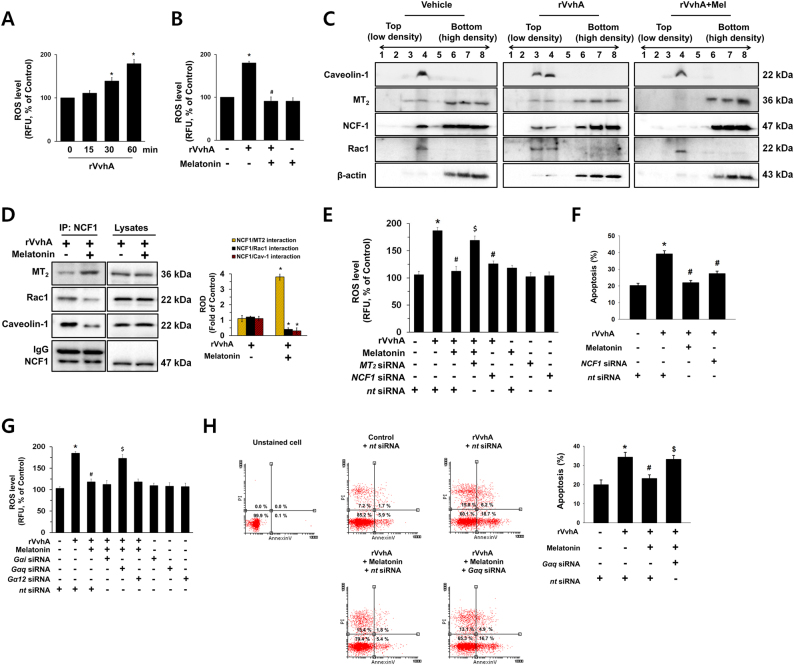
Fig. 2. Melatonin induces NCF-1 binding to MT2 in non-lipid raft to block ROS production and apoptosis in HCT116 cells treated with rVvhA.
a The level of ROS production in cells treated with 50 pg/mL of rVvhA for 60 min is shown. Data represent the means ± S.E. n = 5. *p < 0.05 vs. 0 min. b The level of ROS production in cells treated with melatonin (1 µM) for 30 min prior to rVvhA exposure for 60 min is shown. Data represent the mean ± S.E. n = 4. *p < 0.05 vs. control. #p < 0.01 vs. rVvhA alone. c Caveolin-enriched membrane fractions were prepared by discontinuous sucrose density gradient fractionation from the cell treated with rVvhA for 30 min, and the location of caveolin-1, MT2, NCF-1, and Rac1 was determined by western blot. n = 3. d NCF-1 co-immunoprecipitated with MT2, Rac1, and Caveolin-1 (left side). The level of MT2, Rac1, Caveolin-1, and NCF-1 in total cell lysates is shown in the right side. n = 3. *p < 0.01 vs. rVvhA alone. e Cells transfected with siRNAs for MT2 or NCF-1 were incubated with melatonin (1 µM) for 30 min prior to rVvhA exposure for 60 min. The level of ROS production is shown. Data represent the mean ± S.E. n = 4. *p < 0.05 vs. control. #p < 0.01 vs. rVvhA alone. $nt siRNA < 0.01 vs. rVvhA + melatonin+ nt siRNA. f Cells transfected with siRNAs for non-targeting (nt) control and NCF-1 were incubated with melatonin (1 µM) for 30 min prior to rVvhA exposure for 24 h. Quantitative analysis of the total apoptotic cells by flow cytometer analysis is shown. n = 3. *p < 0.01 vs. nt siRNA. #p < 0.01 vs. rVvhA + nt siRNA. g Cells transfected with siRNAs for Gαi, Gαq and Gα12 were incubated with melatonin (1 µM) for 24 h prior to rVvhA exposure for 60 min. The level of ROS production is shown. Data represent the mean ± S.E. n = 4. *p < 0.05 vs. nt siRNA. #p < 0.01 vs. rVvhA + nt siRNA. $p < 0.01 vs. nt siRNA+ rVvhA+ melatonin. h Cells transfected with siRNAs for Gαq and nt were incubated with melatonin (1 µM) for 24 h prior to rVvhA exposure for 24 h. Quantitative analysis of the percentage of apoptotic cells by flow cytometer analysis is shown. n = 4. *p < 0.01 vs. nt siRNA. #p < 0.01 vs. rVvhA + nt siRNA. $p < 0.01 vs. rVvhA+ melatonin+ nt siRNA

