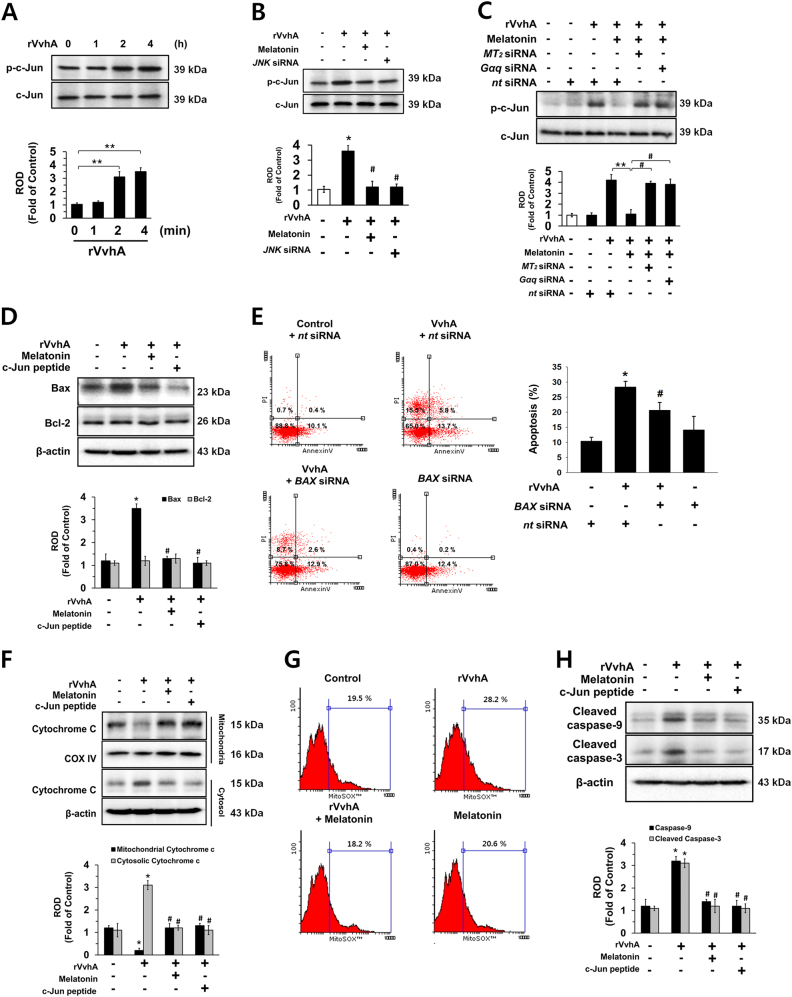
Fig. 4. Regulatory effect of melatonin on apoptotic cell death mediated by c-Jun activation.
a Phosphorylation of c-Jun is shown. n = 3. **p < 0.01 vs. 0 min. b Phosphorylation of c-Jun in a cells treated with melatonin (1 µM) or transfected with siRNAs for JNK for 24 h prior to rVvhA exposure for 4 h is shown. n = 4. *p < 0.01 vs. control. #p < 0.01 vs. rVvhA alone. c Cells transfected with siRNAs for MT2 or Gαq were incubated with melatonin (1 µM) for 30 min prior to rVvhA exposure for 4 h. The level of c-Jun phosphorylation is shown. Data represent the mean ± S.E. n = 4. **p < 0.01 vs. rVvhA+ nt siRNA. #p < 0.01 vs. rVvhA+ melatonin+ nt siRNA. d, e Cells were incubated with c-Jun peptide (100 µM) and melatonin (1 µM) for 30 min prior to rVvhA exposure for 24 h. d Expressions of Bax and Bcl-2 are shown. n = 3. *p < 0.01 vs. control. #p < 0.05 vs. rVvhA alone. e Cells transfected with nt or BAX siRNAs were incubated with melatonin (1 µM) for 30 min prior to rVvhA exposure for 24 h. Quantitative analysis of the percentage of apoptotic cells by flow cytometer analysis is shown. n = 5. *p < 0.05 vs. nt siRNA. #p < 0.05 vs. rVvhA+ nt siRNA. f Expressions of cytochrome C in the mitochondrial and cytosol fraction are shown. n = 3. *p < 0.01 vs. control. #p < 0.01 vs. rVvhA alone. g Mitochondrial ROS production was measured by flow cytometer following staining with MitoSOX. The percentages of MitoSOX-positive cells analyzed by flowing software. n = 4. h Cells were incubated with c-Jun peptide (100 µM) and melatonin (1 µM) for 30 min prior to rVvhA exposure for 24 h. Expressions of caspase-9 and cleaved caspase-3 are shown. n = 3. *p < 0.05 vs. control. #p < 0.05 vs. rVvhA alone.

