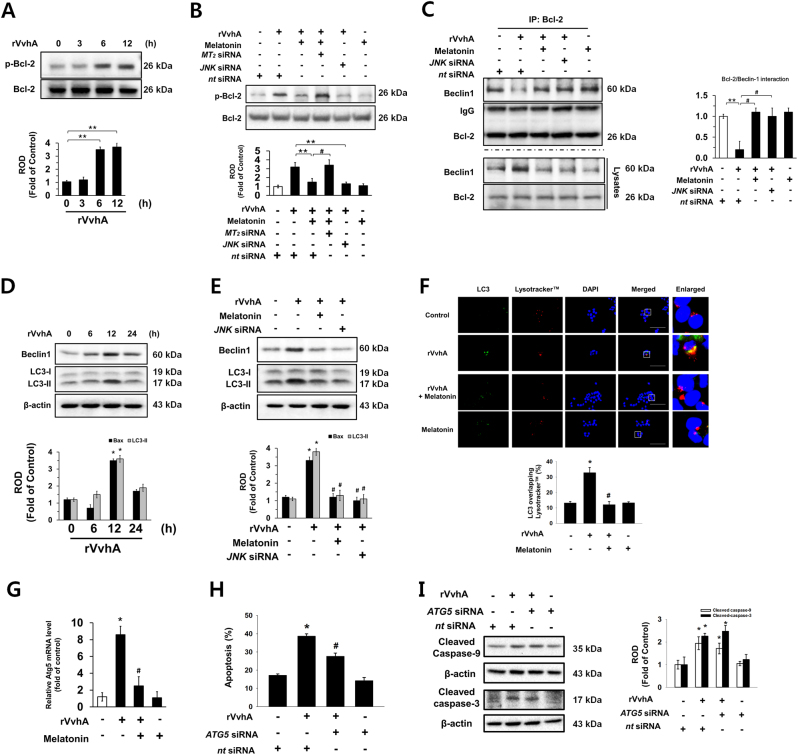
Fig. 5. Regulatory effect of melatonin on autophagic apoptosis mediated by Bcl-2 phosphorylation.
a Phosphorylation of Bcl-2 is shown. n = 3. **p < 0.01 vs. 0 h. b Cells transfected with siRNAs for MT2 and JNK were incubated with melatonin (1 µM) for 30 min prior to rVvhA exposure for 12 h. The level of Bcl-2 phosphorylation is shown. Data represent the mean ± S.E. n = 4. **p < 0.01 vs. rVvhA+ nt siRNA. #p < 0.05 vs. rVvhA+ melatonin+ nt siRNA. c Bcl-2 co-immunoprecipitated with Beclin1 (upper panel). The level of Beclin1 and Bcl-2 in total cell lysates is shown in the bottom panel. n = 3. **p < 0.05 vs. nt siRNA. #p < 0.05 vs. rVvhA+ nt siRNA. d Expressions of Beclin-1 and LC-3 are shown. n = 3. *p < 0.01 vs. 0 h. e Cells transfected with siRNA for JNK were incubated with melatonin (1 µM) for 30 min prior to rVvhA exposure for 12 h. Expressions of Beclin-1 and LC-3 are shown. n = 4. *p < 0.05 vs. control. #p < 0.05 vs. rVvhA. f The cells were immunostained with LC-3 antibody (green), Lysotracker (red) and DAPI (blue). The percentage of co-localization of LC-3 with Lysotracker was measured by Metamorph software. n = 4. Magnification is 400× objective, scale bars are 5 μm. Data are presented as a mean ± S.E. n = 4. *p < 0.05 vs. control. #p < 0.05 vs. rVvhA alone. g The expression of ATG5 mRNA was evaluated by qRT-PCR in the cells treated with melatonin (1 µM) for 30 min prior to rVvhA exposure for 24 h. Data present as a mean ± S.E. n = 4. *p < 0.01 vs. control. #p < 0.01 vs. rVvhA alone. h, i Cells transfected with siRNA for Atg5 were incubated with melatonin (1 µM) for 30 min prior to rVvhA exposure for 24 h. Quantitative analysis of the percentage of apoptotic cells by flow cytometer analysis is shown. n = 4. *p < 0.05 vs. nt siRNA. #p < 0.05 vs. rVvhA+ nt siRNA. The level of cleaved caspase-9 and -3 are shown. Data are presented as a mean ± S.E. *p < 0.05 vs. nt siRNA. #p < 0.05 vs. rVvhA+ nt siRNA

