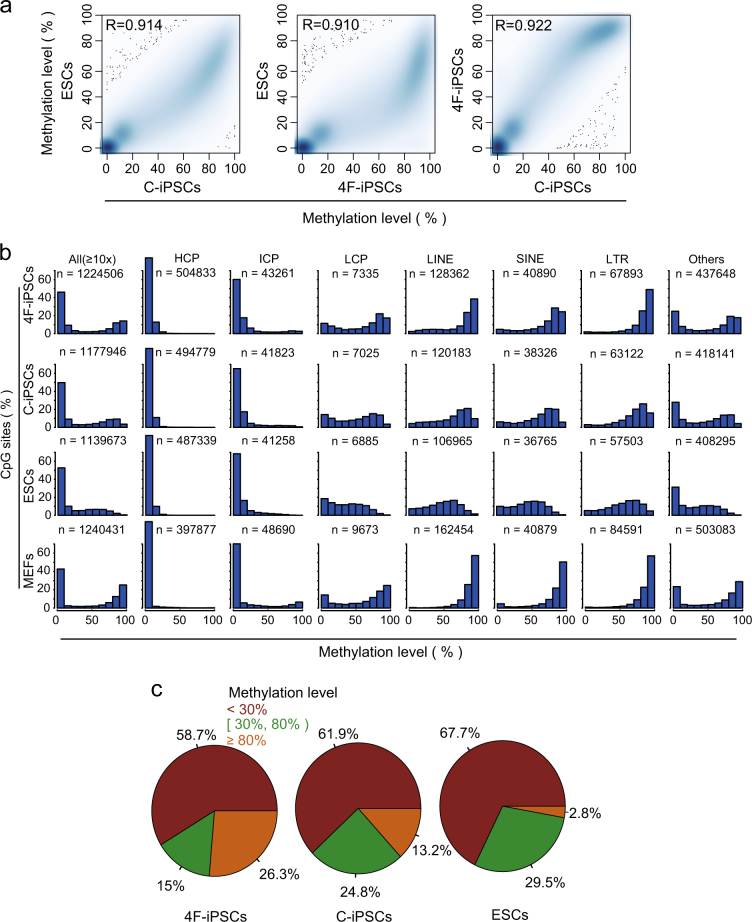
Fig. 1. Profiles of CpG methylation in mESCs, C-iPSCs, and 4F-iPSCs for CpGs with ≥10-fold coverage.
a Density scatter plots of CpG methylation levels between mESCs, C-iPSCs, and 4F-iPSCs. Spearman’s R is indicated. b Histograms showing the distribution of CpG methylation levels (%) in mESCs, C-iPSCs, 4F-iPSCs, and MEFs across the entire genome (All), promoters with different CpG density (HCPs, ICPs, and LCPs), interspersed repeat elements (LINEs, SINEs, and LTRs) and other genomic regions excluding promters and LINEs, SINEs, and LTRs. c Pie charts representing the frequency of CpGs grouped by methylation levels

