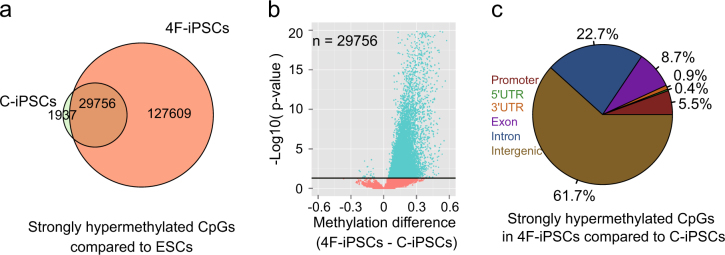
Fig. 2. Comparison of DNA methylation levels between C-iPSCs and 4F-iPSCs.
a Venn diagram showing the overlap between strong hypermethylated CpGs (33.3% higher than mESCs) in C-iPSCs and 4F-iPSCs. b Volcano plot showing the differences in methylation level (4F-iPSCs–C-iPSCs) of the common strong hypermethylated CpGs in C-iPSCs and 4F-iPSCs (the overlapped ones in a). P values are calculated by Fisher’s exact test. The black horizontal line indicates p value = 0.05. c Pie chart representing the strong hypermethylated CpGs in 4F-iPSCs compared to C-iPSCs (increased ≥33.3%) with respect to their genomic locations

