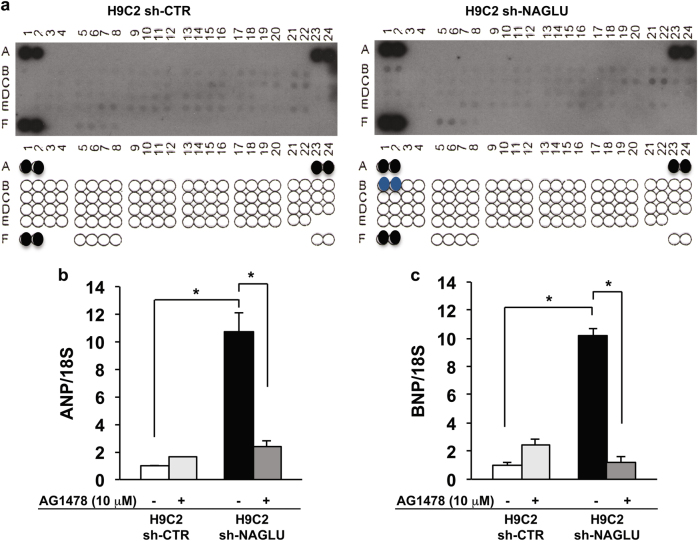
Fig. 3. EGFR activation triggers hypertrophy in NAGLU-silenced H9C2 cardiomyoblasts.
a Effect of NAGLU knockdown on RTK activity. p-RTK array showing the effect of NAGLU silencing on RTK phosphorylation. Cell lysates of H9C2 sh-CTR (left) and H9C2 sh-NAGLU (right) were applied to p-RTK arrays. The chemiluminescent film images (upper panels) are shown. The blue dots in the lower panels indicate the position of EGFR. b, c Expression levels of mRNAs coding for ANP (b) and BNP (c) in H9C2 sh-CTR and H9C2 sh-NAGLU both untreated and treated for 90 min with 10 μM of the EGFR inhibitor AG1478 as measured by quantitative RT-PCR analysis. The amount of ANP and BNP mRNA was normalized with respect to the amount of 18S ribosomal RNA housekeeping gene. The data reported are the mean ± SD of three independent experiments. *P < 0.05

