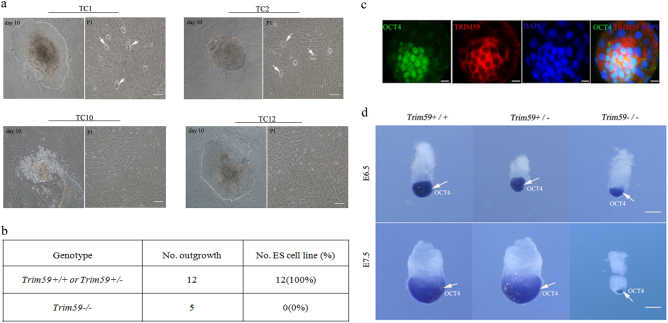
Fig. 4. Trim59 deficiency affects differentiation of blastocyst inner cell mass.
a ES cell clones at passage 1. TC1, TC2, TC10, and TC12, name of outgrowths. TC1 and TC2 were representative images of Trim59+/+ or Trim59+/− genotype, whereas TC10 and TC12 were representative images of Trim59−/− genotype. P1 passage 1. Arrows indicate ES cell clones. Scale bar, 10 µm. b Growth and differentiation of ES cells from Trim59+/+, Trim59+/− and Trim59−/− mice. No. outgrowth number of outgrowths; No. ES cell line number of ES cell line. c Staining of Trim59 and Oct4 in F1 ESCs. F1 ESCs was stained by anti-mouse Trim59 and anti-mouse Oct4 antibody. Images were acquired using a Bio-Rad Radiance 2100 confocal microscope with a Zeiss 63× oil immersion objective. Scale bar, 10 µm. d Hybridization of Oct4 in embryos. Embryos at E6.5 and E7.5 were hybridization using a digoxigenin-labeled anti-sense RNA probe to mouse Oct4. Scale bar, 100 μm. Arrow indicates Oct4

