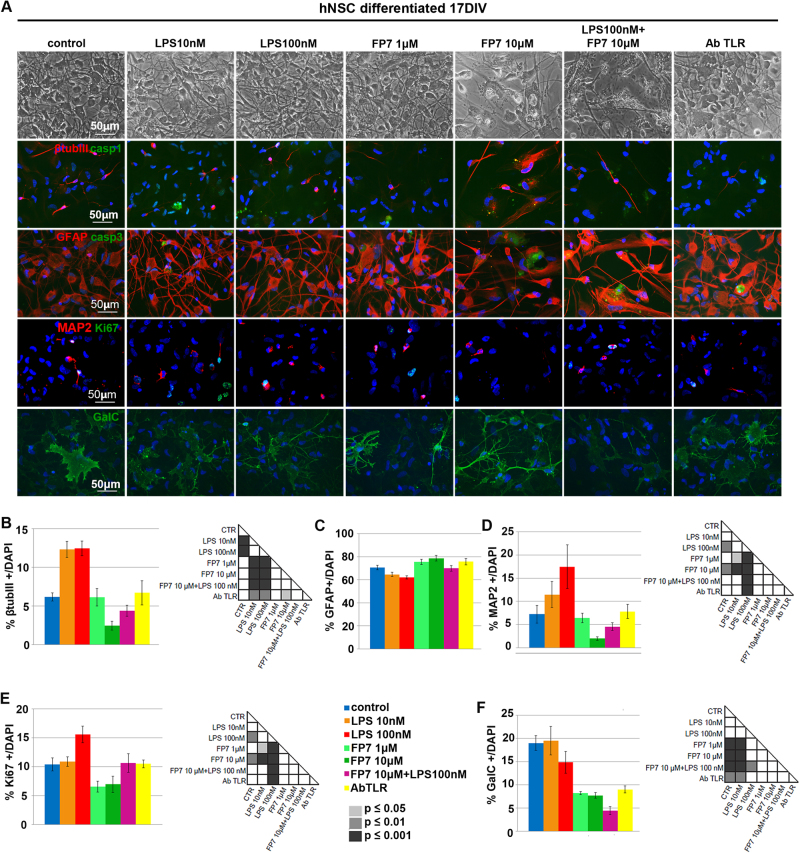
Fig. 6. Effects of TLR4 modulation on late differentiation of hNSC.
a Phase contrast images and immunofluorescence analysis of expression of βtubIII+, Casp1, GFAP, Casp3, MAP2, Ki67, and GalC markers in hNSC differentiated at 17 div after treatment from 0 div with LPS 10 nM, LPS 100 nM, FP7 1 μM, FP7 10 μM, LPS 100 nM+ FP7 10 μM, and AbTLR block. To note, mature GalC+ oligodendrocytes are visible in FP7 10 μM-treated cells only sporadically. Scale bars: 50 μm. b–g Charts showing the quantitative analysis of the percentage of βtubIII+ (b), GFAP (c), MAP2 (d), Ki67+ (e), and GalC+ (f) cells over the total DAPI+ nuclei. Statistical significance is indicated for charts b, d–f. Values are means ± SEM

