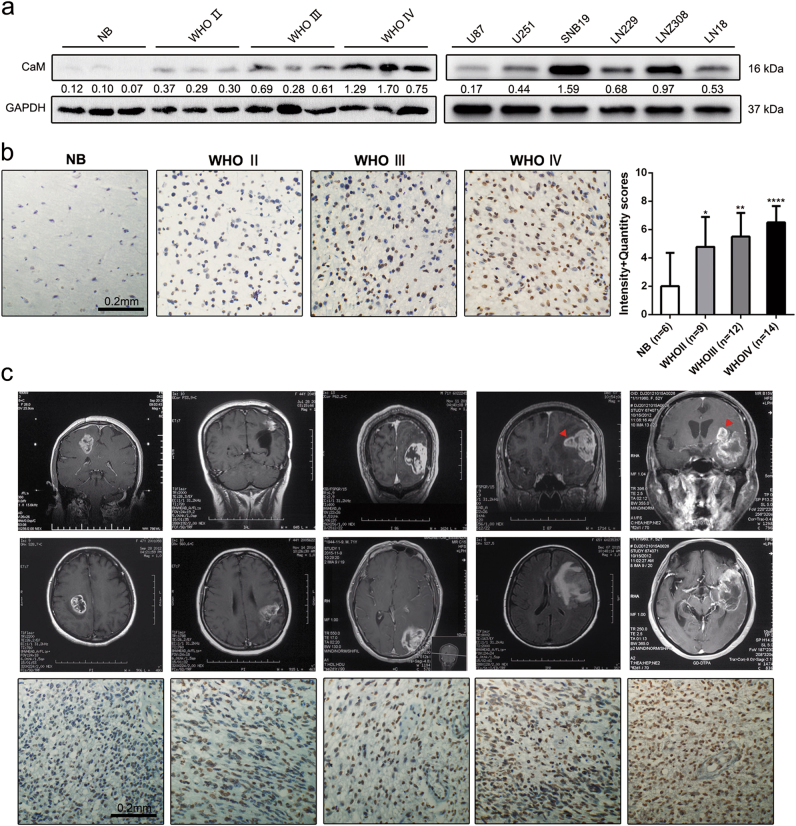
Fig. 1. The expression of CaM in glioma specimens and glioma cell lines.
a CaM protein levels were higher in GBM (n = 3) than in lower-grade glioma (WHO Grade II: n = 3, WHO Grade III: n = 3) and normal tissues (n = 3), as determined by western blot. b CaM expression was increased in GBM samples (n = 14) compared to lower-grade glioma (WHO Grade II: n = 9, WHO Grade III: n = 12) and normal brain tissues (n = 6) using immunohistochemical staining (Data are presented as means ± SDs of three different microscopic visions from every independent experiment, *p < 0.05, **p < 0.01, ****p < 0.0001). c Five GBM patients’ MRI images with representative images of immunohistochemical staining of CaM (Images were taken from three different microscopic visions from every independent experiment, Red triangle: disseminated tumor)

