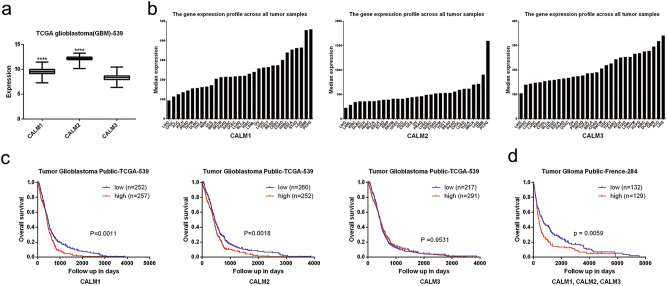
Fig. 2. CaM was associated with poor prognosis and aggressive nature in GBM.
a CALM1, CALM2 and CALM3 mRNA expression in the TCGA GBM data set (CALM1: n = 523, CALM2: n = 523, CALM3: n = 523, ****p < 0.0001). b CALM1, CALM2 and CALM3 expression profile across TCGA pan cancer data set. Images were taken from the GEPIA (Gene Expression Profiling Interactive Analysis) online database (http://gepia.cancer-pku.cn). c Kaplan–Meier representation of the overall survival of the two groups of patients with high or low CALM1, CALM2 and CALM3 expression according to TCGA GBM data set. Statistical analysis was performed with the log-rank test. d Kaplan–Meier representation of the overall survival of the two groups of patients with high or low CaM genes expression according to French glioma data set. Statistical analysis was performed with the log-rank test

