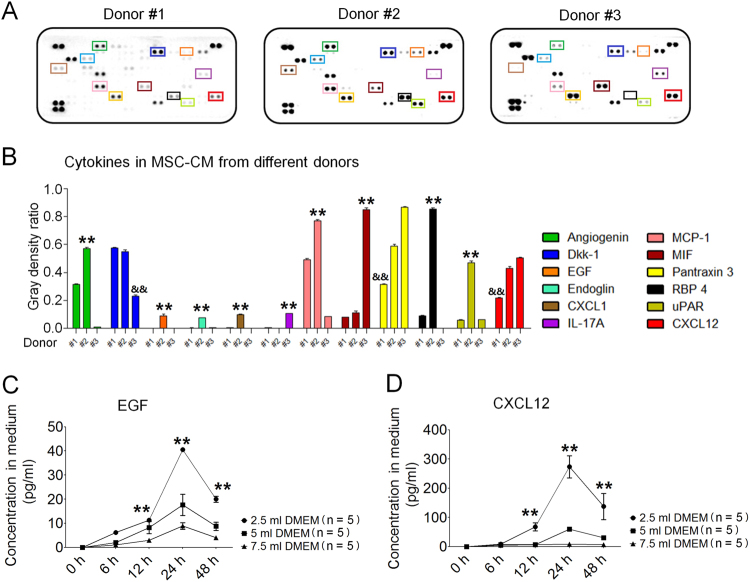
Fig. 1. Cytokine profile of hAd-MSC.
a Cytokine array for MSC-CM from three donors. Each cytokine was detected in duplicate. In each array, blots in the upper-left, upper-right and bottom-left represent positive controls. Target cytokines are indicated using square frames with different colours. Their names are listed in b. b Grey density analyses indicating the levels of cytokines in MSC-CM using Image Pro Plus 6.0 software. The mean value (M) of the grey density of three positive controls was calculated, and the grey density for each point of a target cytokine was divided by M, and this ratio was calculated in duplicate. The ratios were used to compare differences in the cytokine levels among MSC-CM from Donor #1, Donor #2 and Donor #3. Two-way ANOVA analysis was performed. **P ≤ 0.001: significant increase versus other two groups; && ≤ 0.001: significant decrease versus the other two groups. c Human EGF levels in MSC-CM. Each time point consisted of five independent measurements (n = 5). Data represent the mean ± S.D. **P ≤ 0.001: significant increase (2.5 ml of DMEM group versus other two groups, one-way ANOVA). d Human CXCL12 levels in MSC-CM. Each time point consisted of five independent measurements (n = 5). Data represent the mean ± S.D. **P ≤ 0.001: significant increase (2.5 ml of DMEM group versus other two groups, one-way ANOVA)

