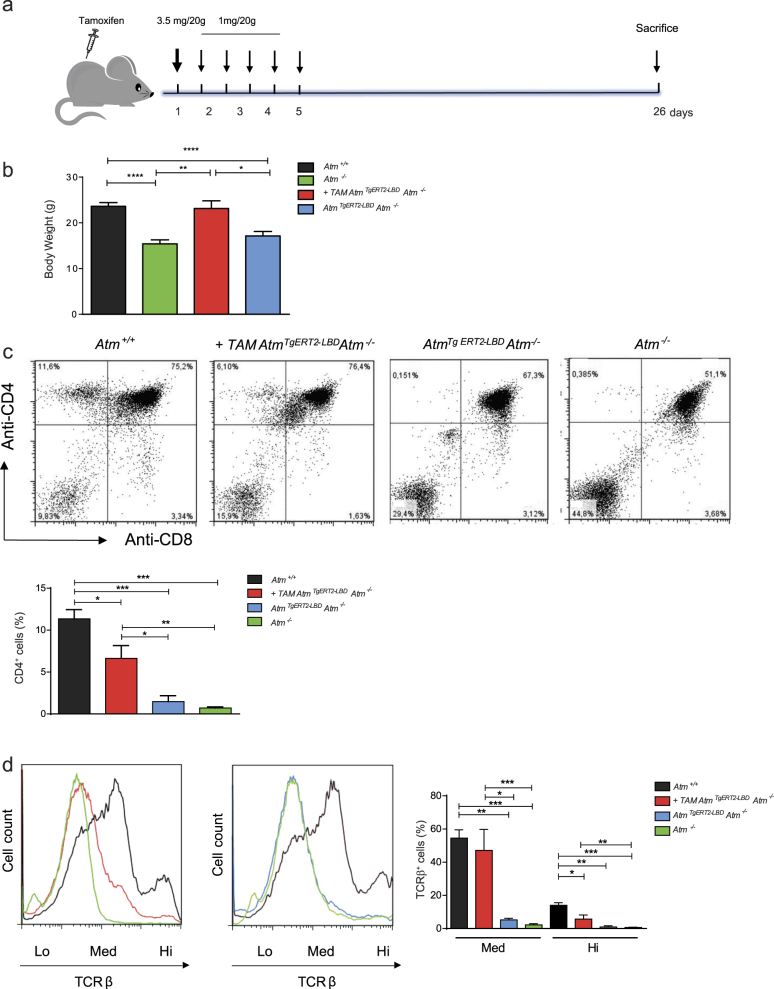
Fig. 2. Activation of AtmTgERT2-LBD partially reconstitutes lymphocyte development.
a Flow chart of the strategy used to restore Atm expression in vivo. Forty-five days old mice were treated with tamoxifen by intraperitoneal injections as shown. Transgenic mice were sacrificed 26 days after the injection. Doses and timing of tamoxifen treatment were described in Materials and methods section. b Histogram showing body weight of Atm+/+, +TAM AtmTg ERT2-LBDAtm−/−, AtmTg ERT2-LBDAtm−/−, and Atm−/− mice measured at the end of experimental protocol (n = 5 mice for each genotype). *P < 0.05, **P < 0.01, and ****P < 0.0001. c Representative flow cytometric analysis of surface expression of CD4 versus CD8 in freshly isolated thymocytes form Atm+/+, +TAM AtmTg ERT2-LBDAtm−/−, AtmTg ERT2-LBDAtm−/−, and Atm−/− mice. Histogram shows the percentage of CD4 single-positive cells. Data are representative of at least n = 4 thymocyte preparations for each genotype in independent experiments. *P < 0.05, **P < 0.01, and ***P < 0.001. d Representative flow cytometry analyses of TCR-β surface marker expression in Atm+/+, +TAM AtmTg ERT2-LBDAtm−/−, AtmTg ERT2-LBDAtm−/−, and Atm−/− mice. The dotted line shows TCR-β expression (low, medium, and high) in freshly isolated thymocytes. Histogram shows the percentage of medium and high TCR-β-expressing cells. Data were obtained from independent experiments performed on at least n = 4 thymocyte preparations for each genotype in independent experiments. *P < 0.05, **P < 0.01, and ***P < 0.001

