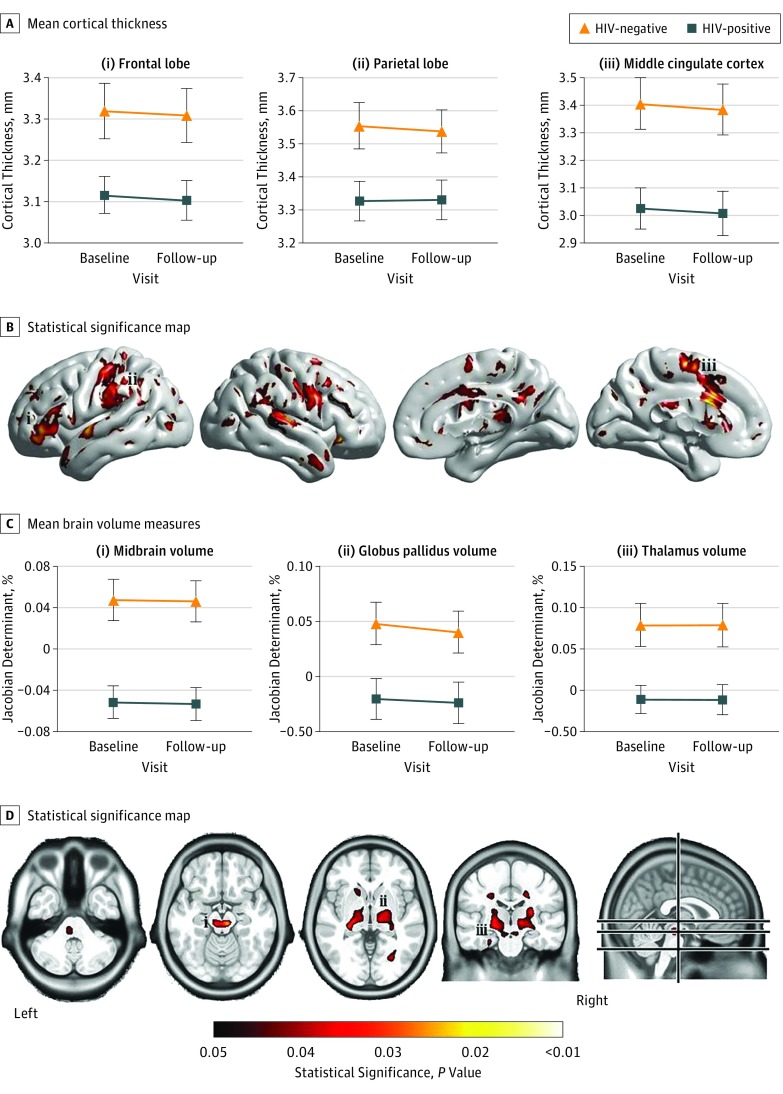
Figure 2. Cortical Thickness and Subcortical Volume Reductions in HIV-Positive and HIV-Negative Participants.
A, Mean cortical thickness estimates at baseline and follow-up visits in the frontal lobe, parietal lobe, and middle cingulate cortex in HIV-positive and HIV-negative control participants. B, Statistical significance map of brain regions that had significantly reduced cortical thickness estimates in the HIV-positive group compared with HIV-negative controls. C, Mean brain volume measures with tensor-based morphometry (TBM) at baseline and follow-up in the midbrain, globus pallidus, and thalamus in HIV-positive and HIV-negative control participants. D, Statistical significance map of brain regions that had significantly smaller volumes in the HIV-positive group compared with HIV-negative controls with TBM (voxel-based morphometry results shown in eFigure 1 in the Supplement). Error bars indicate SE. The values under the color spectrum are P values.

