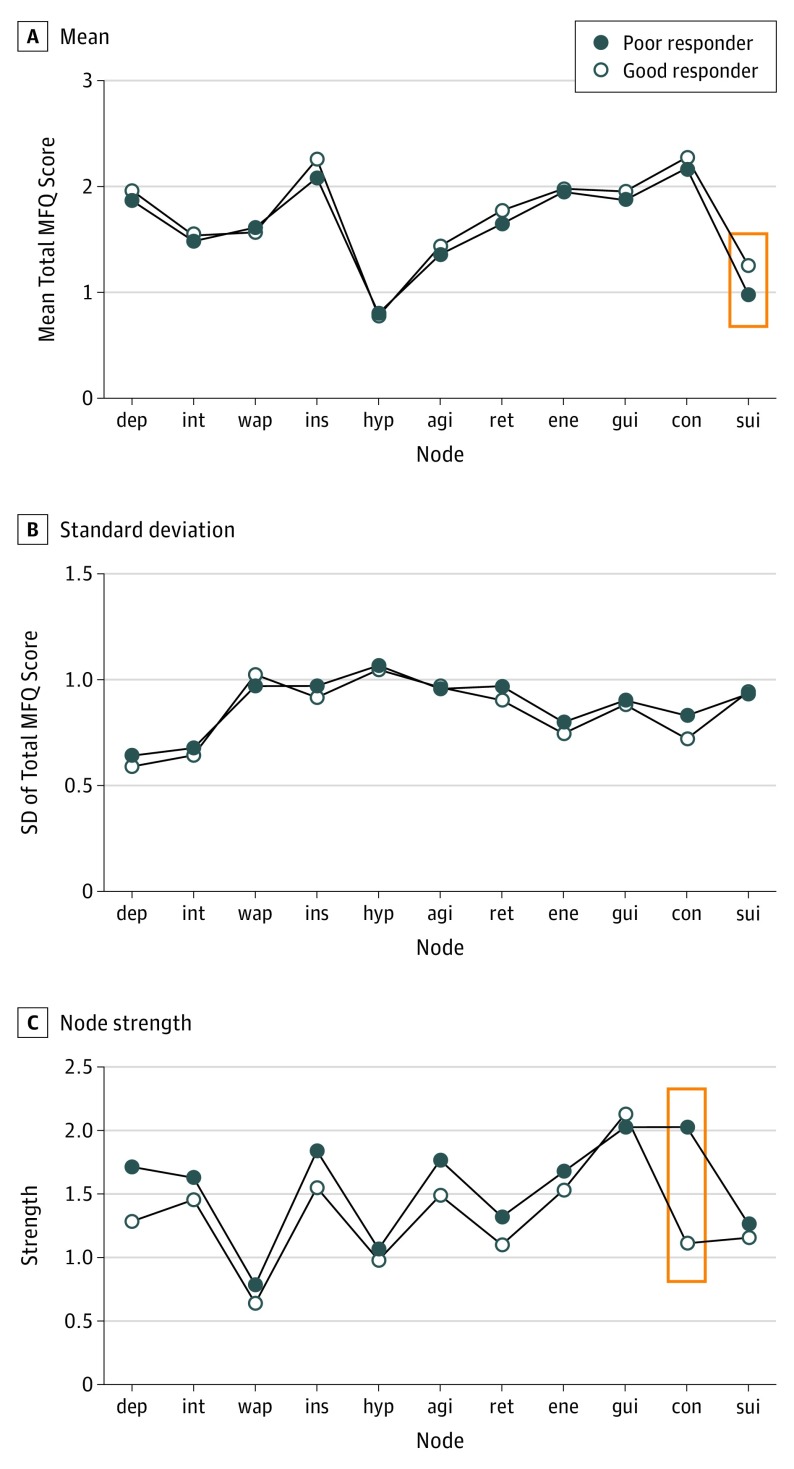
Figure 2. Differences in Total Mood and Feelings Questionnaire (MFQ) Mean Score, SD of the Mean Score, and Node Strength by Symptom Between Good and Poor Responders to Treatment.
Red boxes outline statistically significant differences. Symptom (node) abbreviations are defined in the caption to Figure 1.

