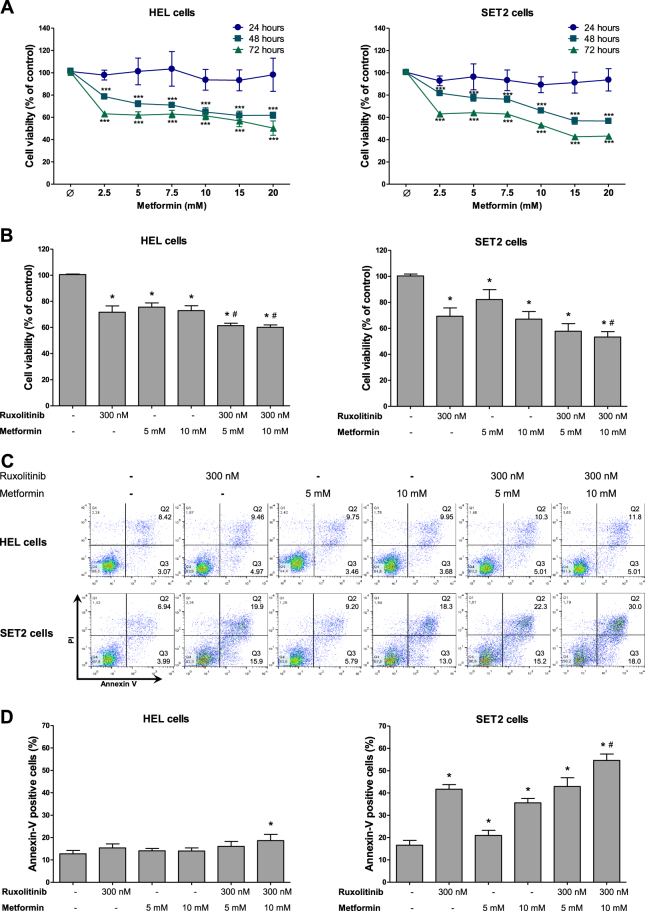
Fig. 1. Metformin potentiates ruxolitinib-induced cell viability reduction in JAK2V617F cells.
a Dose-response and time-response cytotoxicity curves analyzed by methylthiazoletetrazolium (MTT) assay for HEL and SET2 cells treated with metformin for 24, 48 and 72 h. Values are expressed as the percentage of viable cells for each condition relative to untreated controls. Results are shown as the mean ± SD of four independent experiments. ***p < 0.0001 for metformin-treated cells vs. untreated cells; ANOVA test and Bonferroni post-test, all pairs were analyzed and statistically significant differences are indicated. b Cell viability was determined by MTT assay in HEL or SET2 cells treated, or not, with the indicated concentrations of ruxolitinib and/or metformin for 48 h and normalized to corresponding untreated cells. Bar graphs represent the mean ± SD of at least four independent experiments. c Apoptosis was detected by flow cytometry in HEL or SET2 cells treated with ruxolitinib and/or metformin for 48 h using an annexin V/PI staining method. Representative dot plots are shown for each condition; the upper and lower right quadrants (Q2 plus Q3) cumulatively contain the apoptotic population (annexin V+ cells). d Bar graphs represent the mean ± SD of at least four independent experiments quantifying apoptotic cell death. The p values and cell lines are indicated in the graphs. *p < 0.05 for metformin-treated and/or ruxolitinib-treated cells vs. untreated cells, #p < 0.05 for metformin-treated or ruxolitinib-treated cells vs. combination treatment at the corresponding doses; ANOVA test and Bonferroni post-test, all pairs were analyzed and statistically significant differences are indicated

