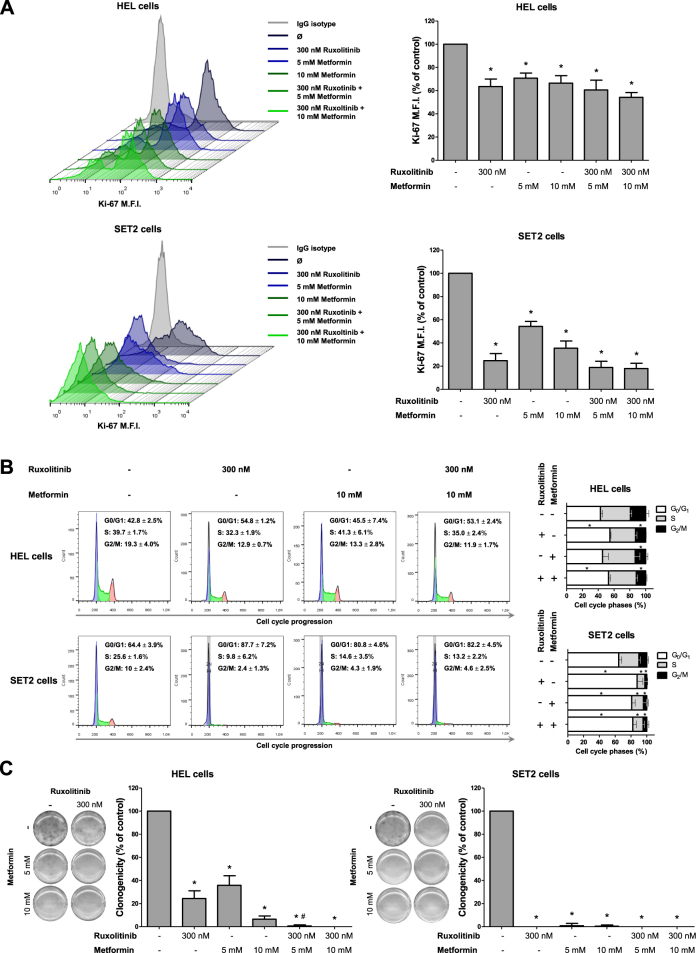
Fig. 2. Metformin and ruxolitinib reduce cell proliferation and delay cell cycle progression in HEL and SET2 cells.
a Ki-67 mean fluorescence intensity (MFI) was determined by flow cytometry after incubation of HEL or SET2 cells treated with ruxolitinib and/or metformin for 48 h; histogram traces are illustrated. The bar graphs represent the Ki-67 M.F.I normalized to the respective untreated control cells, and results are shown as mean ± SD of four independent experiments; *p < 0.05, ANOVA test and Bonferroni post-test, all pairs were analyzed and statistically significant differences are indicated. b Cell cycle progression was determined by BD Cycletest™ Plus DNA Reagent Kit in HEL or SET2 cells treated with the indicated concentrations of ruxolitinib and/or metformin for 48 h. A representative histogram for each condition is illustrated. Bar graphs represent the mean ± SD of the percent of cells in G0/G1, S and G2/M phase upon ruxolitinib (300 nM) and/or metformin (10 mM) for 48 h and represent at least four independent experiments. The p values and cell lines are indicated in the graphs. *p < 0.05 for metformin-treated and/or ruxolitinib-treated cells vs. untreated cells; ANOVA test and Bonferroni post-test, all pairs were analyzed and statistically significant differences are indicated. c Colonies containing viable cells were detected by MTT after 10 days of culture of HEL and SET2 cells treated with ruxolitinib and/or metformin and normalized to the corresponding untreated controls. Colony images are shown for one experiment and the bar graphs show the mean ± SD of at least four independent experiments. The p values and cell lines are indicated in the graphs: *p < 0.05 for metformin-treated and/or ruxolitinib-treated cells vs. untreated cells, #p < 0.05 for metformin-treated or ruxolitinib-treated cells vs. combination treatment at the corresponding doses; ANOVA test and Bonferroni post-test, all pairs were analyzed and statistically significant differences are indicated

