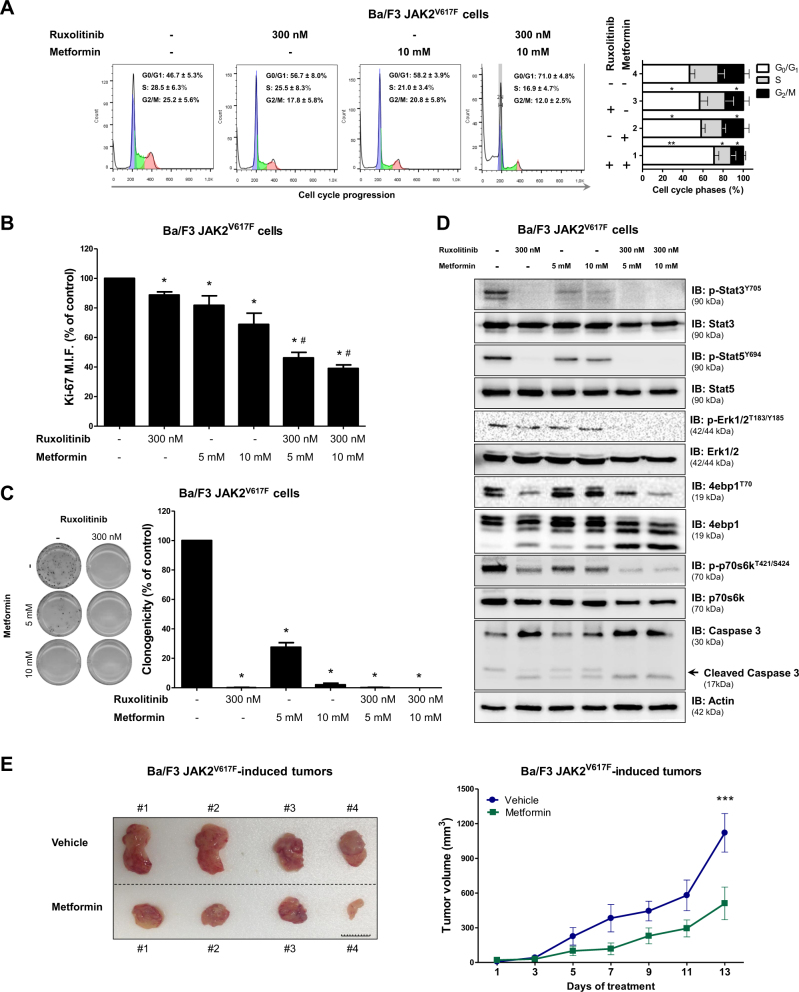
Fig. 4. Metformin delays cell cycle progression, reduces colony formation, downregulates JAK2/STAT activation and decreases tumor burden in Ba/F3 JAK2V617F cells.
a Cell cycle phase profiling was determined by BD Cycletest™ Plus DNA Reagent Kit in Ba/F3 JAK2V617F cells treated with ruxolitinib and/or metformin for 24 h. A representative histogram for each condition is illustrated. Bar graphs represent the mean ± SD of the fraction of cells in G0/G1, S and G2/M phase for each treatment condition across at least four independent experiments. b Ki-67 MFI was determined by flow cytometry after incubation of Ba/F3 JAK2V617F cells treated with the indicated concentrations of ruxolitinib and/or metformin for 24 h. The Ki-67 M.F.I was normalized to the respective untreated control cells and results are shown as the mean ± SD of four independent experiments. c Colonies containing viable cells were detected by MTT after 10 days of culture of Ba/F3 JAK2V617F cells treated with ruxolitinib and/or metformin and normalized to the corresponding untreated controls. Colony images are shown for one experiment and the bar graphs show the mean ± SD of at least four independent experiments. d Western blot analysis for p-Stat3Y705, p-Stat5Y694, p-Erk1/2T183/Y185, p-4ebp1T70, p-p70s6kT421/S424 and caspase 3 (total and cleaved) levels in total cell extracts from Ba/F3 JAK2V617F cells treated with ruxolitinib and/or metformin for 24 h; membranes were reprobed with the antibody for the detection of the respective total protein or actin, and developed with the SuperSignal™ West Dura Extended Duration Substrate system and a Gel Doc XR+ system. e Images and volumes (mean ± SEM) of tumors induced by subcutaneous injection of Ba/F3 JAK2V617F cells in NSG mice, treated with vehicle (PBS) (n = 4) or metformin (125 mg/kg/day) (n = 4). Tumor volume (V) was calculated using the formula (V = W2 × L × 0.52), where W and L represent the smallest and largest diameters, respectively. Images of individual animal tumors are shown; Scale Bar: 10 mm. The p values and cell lines are indicated in the graphs. *p < 0.05, **p < 0.01, ***p < 0.001 for metformin-treated and/or ruxolitinib-treated cells vs. untreated-cells, #p < 0.05 for metformin-treated or ruxolitinib-treated cells vs. combination treatment at the corresponding doses; ANOVA test and Bonferroni post-test, all pairs were analyzed and statistically significant differences are indicated

