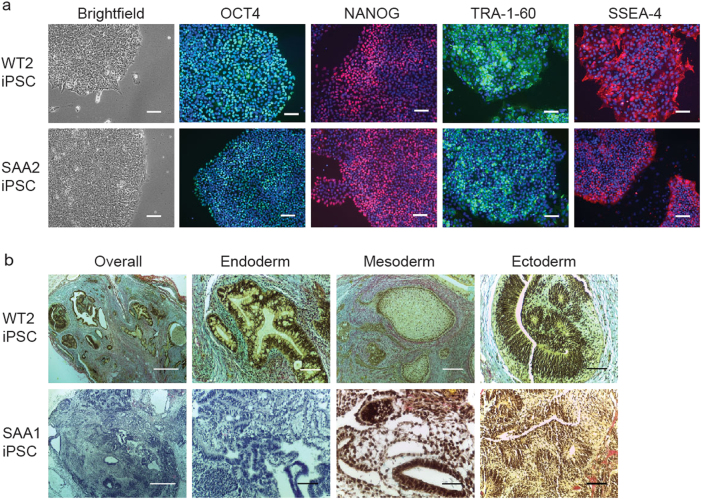
Fig. 1. SAA-iPSC lines display in vitro hallmarks of pluripotency.
a Brightfield images of control and SAA-iPSC colonies displaying typical ESC-like morphology and staining of control and SAA-iPSC colonies with pluripotency markers. DAPI staining is shown in blue. Scale bars, 100 µm; b Histological analysis of representative teratomae generated for control and SAA-iPSC lines displaying trilineage differentiation. Scale bars, overall 500 µm, ectoderm 100 µm, mesoderm 200 µm, ectoderm 100 µm

