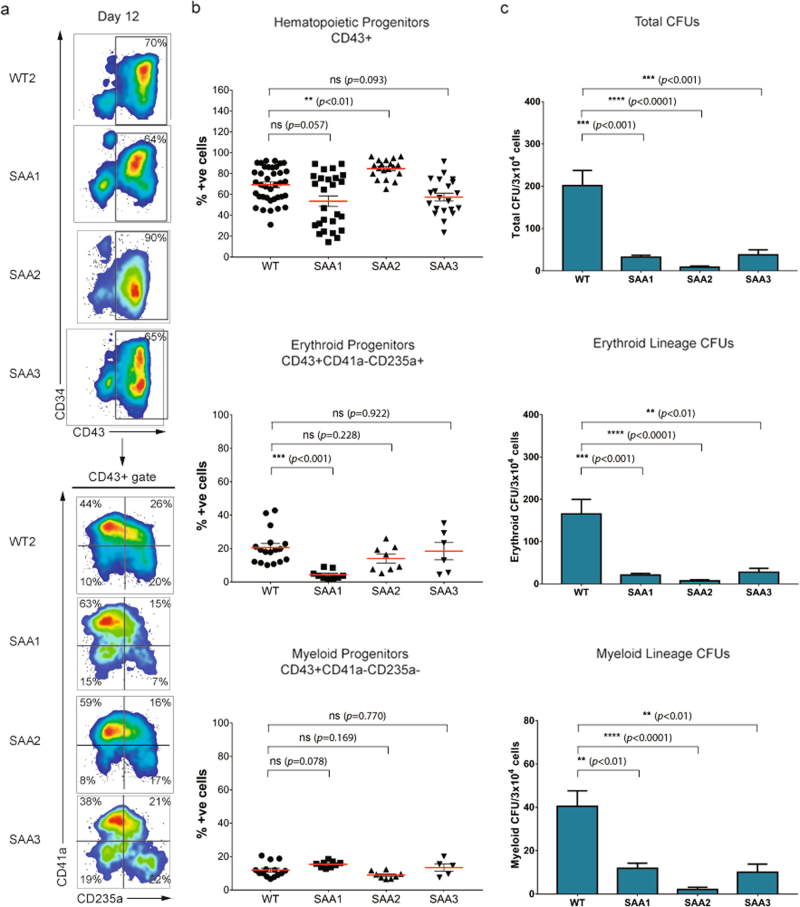
Fig. 3. SAA-iPSC-derived-hematopoietic progenitors show a reduced colony-forming potential.
a Representative images of flow cytometric analysis of CD34 and CD43 expression and CD41 and CD235 expression on CD43+ population in WT and SAA cell lines on day 12 of differentiation; b Analysis of percentages of hematopoietic progenitors (CD43+), erythroid progenitors (CD43+CD41a−CD235a+) and myeloid progenitors (CD43+CD41a−CD235a-) in WT and SAA cell lines on day 12. Kruskal-Wallis with Dunn’s multiple comparison test was used for hematopoietic progenitors and one-way ANOVA with Dunnett’s multiple comparison test was used for erythroid and myeloid progenitors for statistical comparison between WT and SAA cell lines in; c Analysis of total colony-forming units (CFUs), erythroid-lineage CFUs and myeloid-lineage CFUs generated from WT and SAA-iPSC based hematopoietic progenitors on day 12. One-way ANOVA with Dunnett’s multiple comparison test was used for statistical comparison between WT and SAA cell lines; b, c data is presented as mean of at least three independent experiments ± S.E.M. Data for all control cell lines is averaged in one group (WT)

