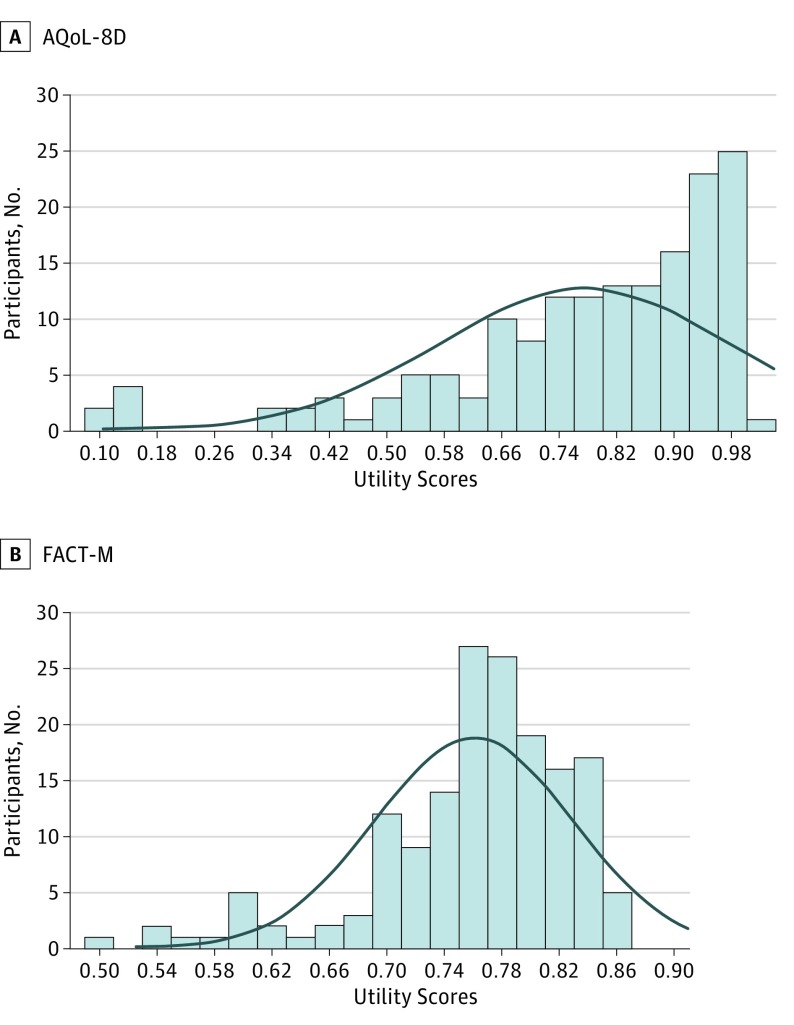
Figure 1. Frequency Distribution of Participant Quality-of-Life Scores.
There were a total of 163 participants normally distributed, as indicated by the curved lines; Kolmogorov-Smirnov test, Pr > D is 0.010. AQoL-8D indicates the Assessment of Quality of Life–8-Dimension scale; FACT-M, Functional Assessment of Cancer Therapy–Melanoma scale.

