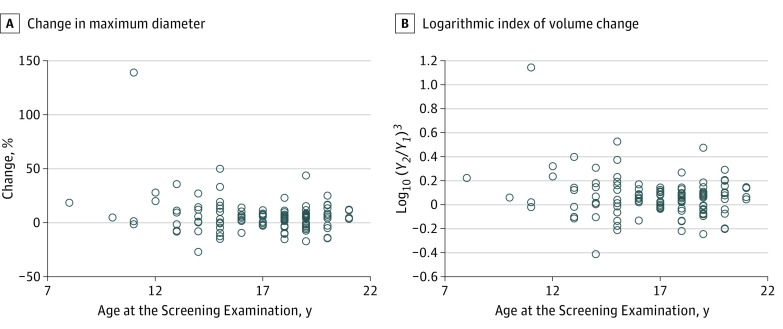
Figure 3. Correlation Between Age and Tumor Growth.
A, Percentage change in maximum tumor diameter at the screening examination. B, Logarithmic index of volume change. Y1 indicates tumor diameter in the screening examination (millimeters); Y2, tumor diameter in the confirmatory examination (millimeters). There were no significant correlations (Spearman ρ = –0.065; 95% CI, –0.245 to 0.118).

