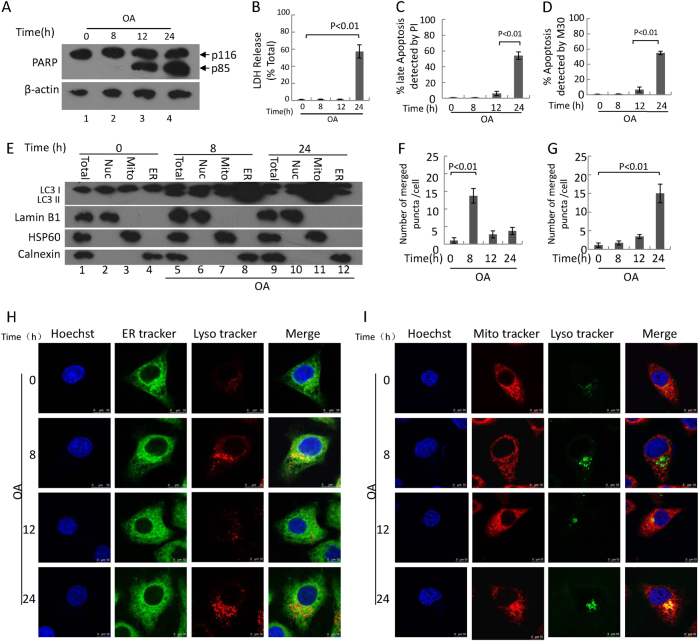
Fig. 2. OA treatment induces apoptosis, cell impairment, reticulophagy, and mitophagy development.
HepG2 cells were treated with 400 μM OA for 24 h. a Representative western blotting analysis of cleaved PARP fragment in cells. b The levels of LDH release in supernatant. c, d Quantification of apoptotic cells by Calcein AM/PI(B) and M30(C) immunoreactivity. Data are presented as mean ± SEM in three independent experiments. e Subcellular fractions of HepG2 cells were subjected to a western blotting assay with indicated antibodies. Lamin B1, HSP60, and calnexin were used as controls for the nuclei (Nuc), mitochondrial (Mito), and endoplasmic reticulum (ER) fractions, respectively. Total: total lysate of cells. h The degree of colocalization of endoplasmic reticulum with lysosomes in HepG2 cells was measured via live-cell imaging microscopy. LysoTracker Red DND-99 staining was applied to mark lysosomal structures (red), and ER-Tracker Green to visualize endoplasmic reticulum (green). Hoechst 33342 dye was used to stain nuclei (blue). A positive colocalization is indicated by yellow signals (merge) due to the overlap of LysoTracker Red and ER-Tracker Green staining. Scale bars: 10 μm. i The degree of colocalization of mitochondria with lysosomes in HepG2 cells. LysoTracker was green pseudo, and MitoTracker was red. A positive colocalization is indicated by yellow signals (merge) due to the overlap of LysoTracker Red and MitoTracker Green staining. Scale bars: 10 μm. f, g Quantification of the merged number which was yellow. Data are presented as mean ± SEM in three independent experiments

