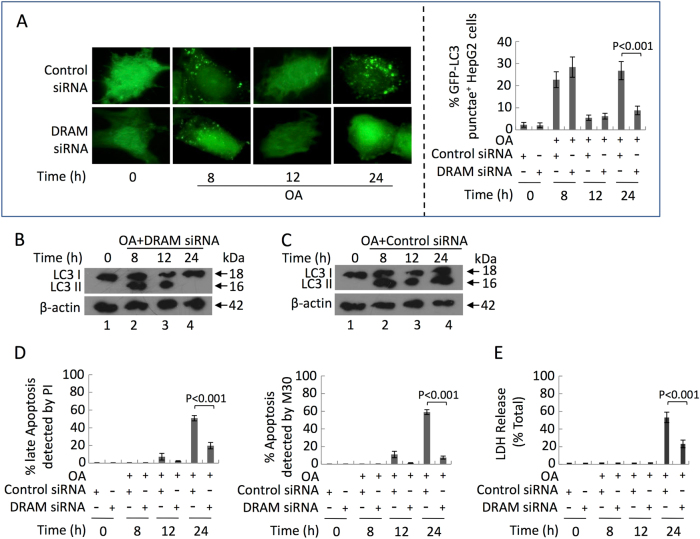
Fig. 7. Following 400 μM OA treatment, DRAM expression induced the second wave of autophagy.
HepG2 cells were pre-treated with DRAM siRNA and then cultured with 400 μM OA. a Representative GFP-LC3 images (left panel, original magnification, ×1000), quantification of autophagosome formation (right panel). b, c Lysates of HepG2 cells were collected, and an immunoblot assay was conducted with the indicated antibodies. d Quantification of apoptotic cells by calcein AM/PI and M30 immunoreactivity. e The levels of LDH release. a, d, e Data are presented as mean ± SEM in three independent experiments

