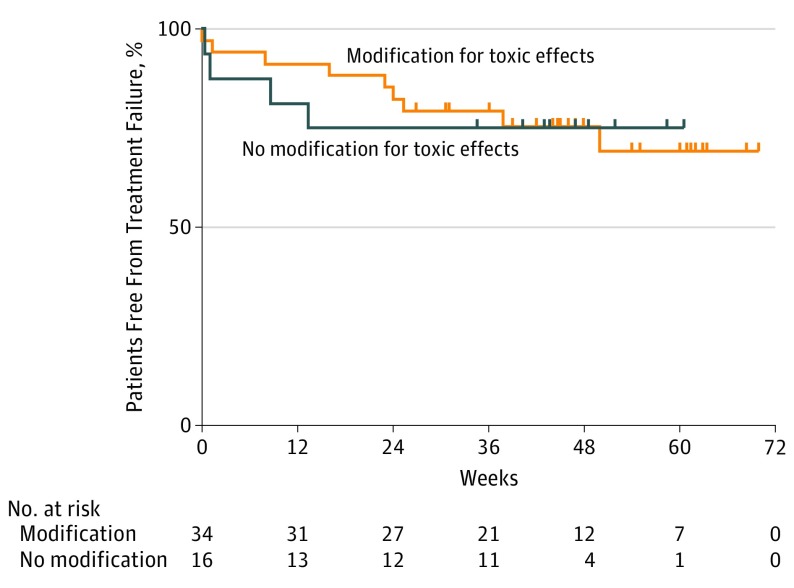
Figure. Time to Treatment Failure in Patients Who Modified vs Did Not Modify Therapy for Toxic Effects.
Time to treatment failure, landmarked at 12 weeks, in patients who stopped combination or programmed cell death protein 1 maintenance for toxic effects (n = 34) and those who did not (n = 16). This did not vary significantly (P = .95, log-rank). Week 0 in this landmark analysis corresponds to day 84 of therapy, and all patients who experienced disease progression prior to day 84 are excluded.

