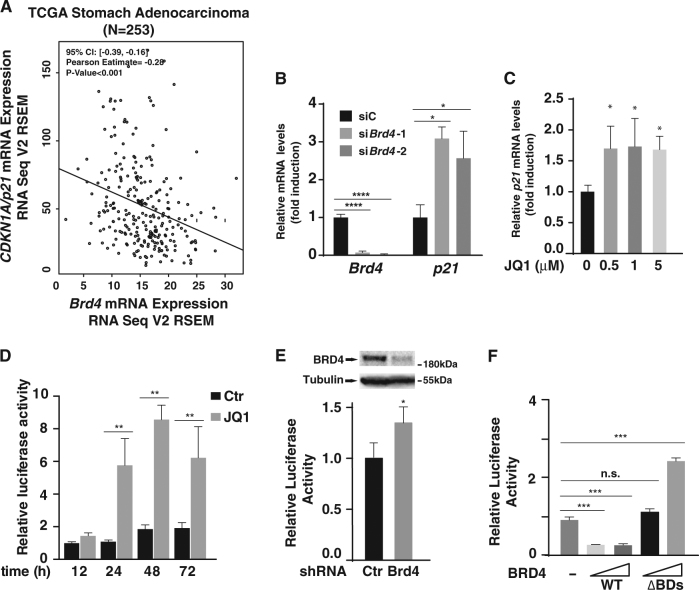
Fig. 4. BRD4 regulates the 3′-UTR of p21.
a Scatterplots of Brd4 mRNA expression level versus p21/CDKN1A mRNA expression level in Stomach Adenocarcinoma (STAD) in The Cancer Genome Atlas (TCGA). Data are acquired from TCGA cBioportal and analyzed by R programming. 95% Confident Intervals (CI), Pearson correlation coefficients and P values are displayed. b MKN28 cells were transfected with control siRNA, and two sets of BRD4 siRNA for 24 h and the levels of Brd4 and p21 mRNA were measured by RT-PCR. Data represent the average of three independent experiments. c MKN28 cells were treated with DMSO or different concentrations of JQ1 for 24 h and the levels of p21 mRNA were measured by RT-PCR. Data represent the average of three independent experiments. d The p21 3′-UTR luciferase reporter plasmids were transfected into MKN28 cells with or without JQ1 treatment. Luciferase activity was measured as indicated time points after transfection. Data represent the average of three independent experiments. e MKN28 cells were infected with lentiviruses expressing control or Brd4 shRNA. 24 h later, infected cells were transfected with p21 3′-UTR luciferase reporter plasmids. Luciferase activity was measured 24 h after transfection. Data represent the average of three independent experiments. f MKN28 cells were transfected with p21 3′-UTR luciferase reporter plasmids together with expression vectors for BRD4 or BRD4(ΔBDs). Luciferase activity was measured 48 h after transfection. Data represent the average of three independent experiments

