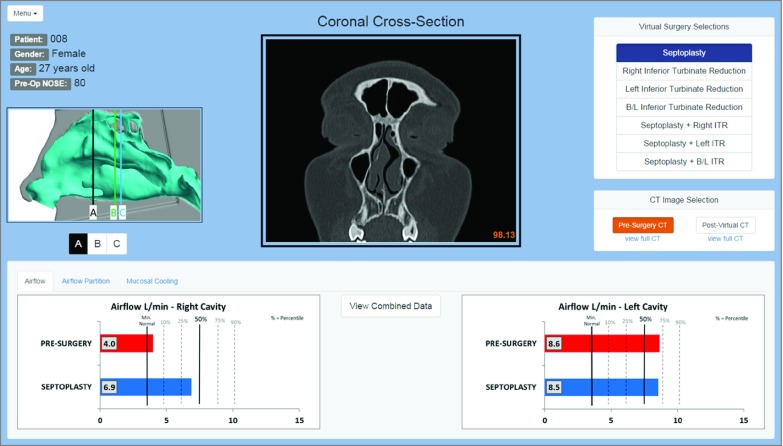
Figure 1. Virtual Surgery Dashboard.
Seven virtual surgery scenarios are available to choose from at the top right of the dashboard. Computed tomography (CT) imaging and computational fluid dynamics variable predictions change with the different surgical selections. For each virtual surgery procedure, surgeons can view a presurgery CT or simulated postsurgery CT at 3 different coronal sections (A, B, C) whose locations are displayed in the box on the left. The full presurgery coronal CT as well as a full virtual surgery coronal CT are also available to view. Computational fluid dynamics variable predictions are listed at the bottom of the screen with separate tabs for airflow, airflow partition, and mucosal cooling. Both right and left nasal cavity values are shown, with graphs showing the presurgery value and the predicted value based on the specific virtual procedure. A combined graph that lists all 3 variables in the left and right cavities for all surgical combinations is also available for review (eFigure 3 in the Supplement) by clicking the button at the center of the screen.

