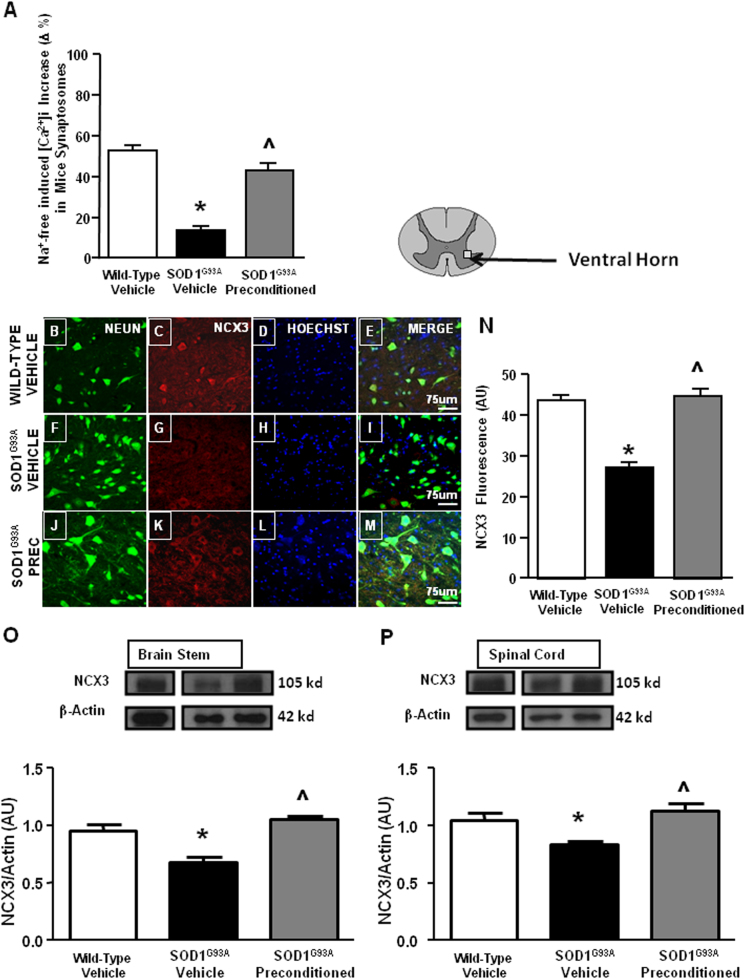
Fig. 2. NCX3 immunolocalization, expression, and quantification of total NCX activity in SOD1 G93A mice subjected to L-BMAA-induced PC.
Quantification of NCX activity as [Ca2+]i increase induced by Na+-free perfusion in Fura-2 AM-loaded spinal cord synaptosomes of adult wild-type mice treated with vehicle and symptomatic SOD1 G93A mice treated with vehicle or preconditioned with L-BMAA. *P < 0.05 vs. wild-type vehicle; ^P < 0.05 vs. SOD1 G93A mice (a). Double labeling of NCX3 and NeuN in spinal cord of pre-symptomatic wild-type mice (b–e), SOD1 G93A mice treated with vehicle (f–i) and SOD1 G93A mice treated with L-BMAA PC (j–m). Scale bar 75 μm. Quantification of NCX3 fluorescence as arbitrary units (AU). *P < 0.05 vs. wild-type vehicle; ^P < 0.05 vs. SOD1 G93A mice (n). Representative Western blotting and quantification of the effect of L-BMAA-induced PC on NCX3 protein expression, arbitrary units (AU), in brain stem (o) and spinal cord (p). *P < 0.05 vs. wild-type vehicle; ^P < 0.05 vs. SOD1 G93A mice. The β-actin expression level was used for normalization. Data are expressed as mean ± SEM (n = 5–6 for each group). *P < 0.05 vs. wild-type vehicle and SOD1 G93A preconditioned mice. P values were obtained using one-way ANOVA with Newman Keuls’s correction for multiple comparisons

