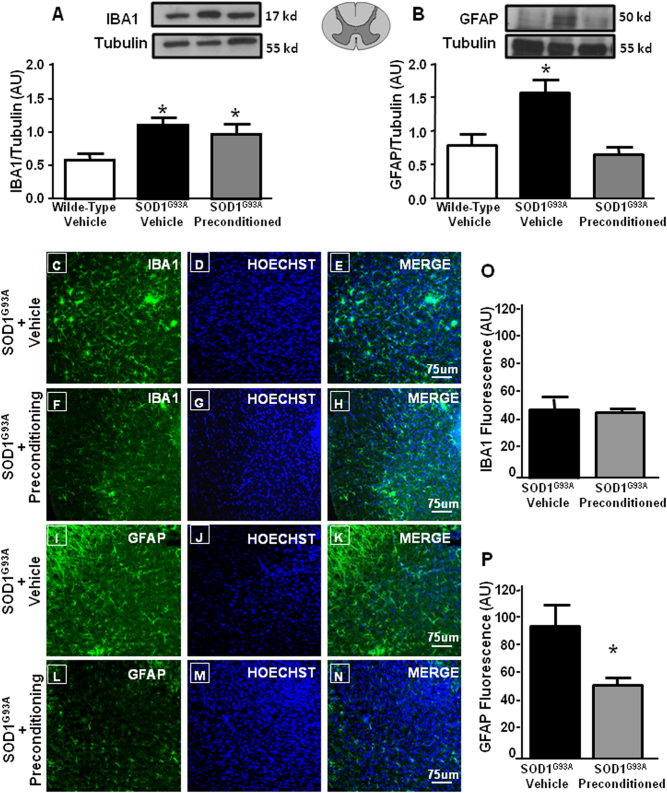
Fig. 4. Effect of l-BMAA-induced PC on glial activation.
Representative western blotting and quantification of the effect of l-BMAA-induced PC on IBA1 (a) and GFAP (b) expression, arbitrary units (AU). The tubulin expression level was used for normalization. Data are expressed as mean ± SEM (n = 4 for each group). *P < 0.05 vs wild-type vehicle. P values were obtained using one-way ANOVA with Newman Keuls’s correction for multiple comparisons. Single labeling of IBA1 in spinal cord of symptomatic SOD1 G93A mice treated with vehicle (c–e) and SOD1 G93A mice treated with l-BMAA PC (f–h). Single labeling of GFAP in spinal cord of symptomatic SOD1 G93A mice treated with vehicle (i–k) and SOD1 G93A mice treated with l-BMAA PC (l–n). Scale bar 75 μm. Quantification of IBA1 (o) and GFAP (p) fluorescence as arbitrary units (AU). *P < 0.05 vs. SOD1 G93A vehicle mice (Student’s t-test)

