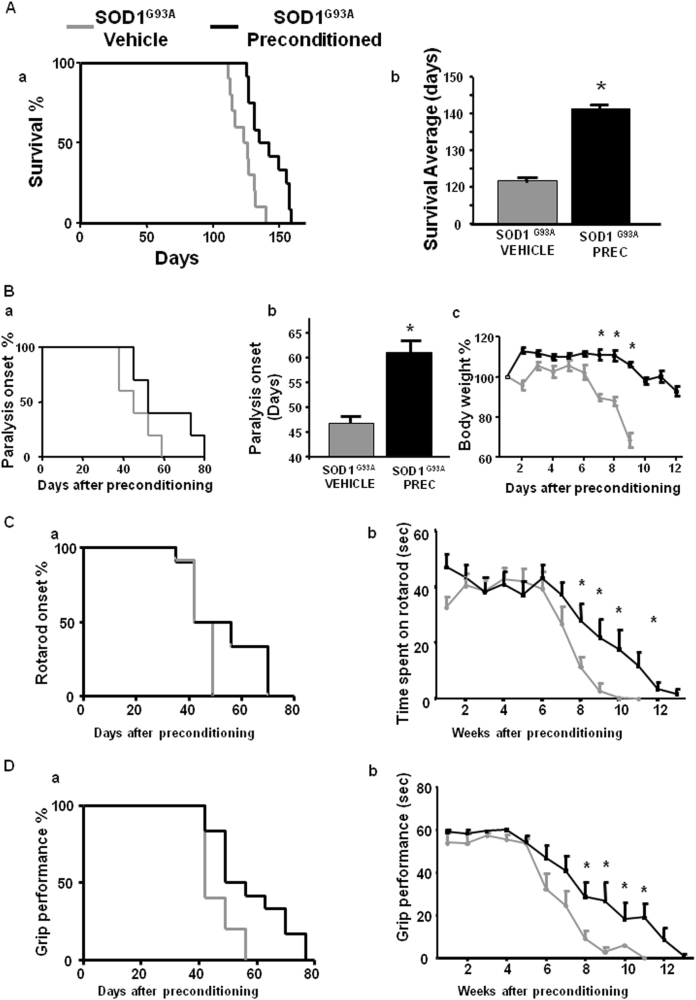
Fig. 7. Effect of l-BMAA-induced PC on survival, paralysis onset, body weight reduction, and motor functions in SOD1 G93A mice.
Survival curve of SOD1 G93A mice treated with vehicle compared to l-BMAA preconditioned SOD1 G93A mice (Aa, b). Survival is expressed as percentage (Aa) or in days (Ab). Paralysis onset of SOD1 G93A mice treated with vehicle compared to l-BMAA preconditioned SOD1 G93A mice (Ba, b). Paralysis onset is expressed in days after treatment with vehicle or l-BMAA PC (Ba) or as percentage (Bb). Percentage of body weight reduction in SOD1 G93A vehicle compared to SOD1 G93A mice preconditioned with l-BMAA (Bc). Percentage of rotarod onset and time spent on rotarod by SOD1 G93A mice treated with vehicle compared to SOD1 G93A mice preconditioned with l-BMAA (Ca, b). Grip performance of SOD1 G93A mice treated with vehicle compared to SOD1 G93A mice preconditioned with l-BMAA expressed as percentage (Da) or in seconds (Db). Data are expressed as mean ± SEM for A, b; B, b, c; C,b; and D, b. n = 10 for SOD1 G93A mice treated with vehicle, n = 12 for SOD1 G93A mice preconditioned with l-BMAA, *P < 0.05 vs. SOD1 G93A vehicle mice. Kaplan–Meier plot was used for Aa, Ba, Ca, and Da. Student’s t-test was used for Ab, Bb, c, Cb, Db

