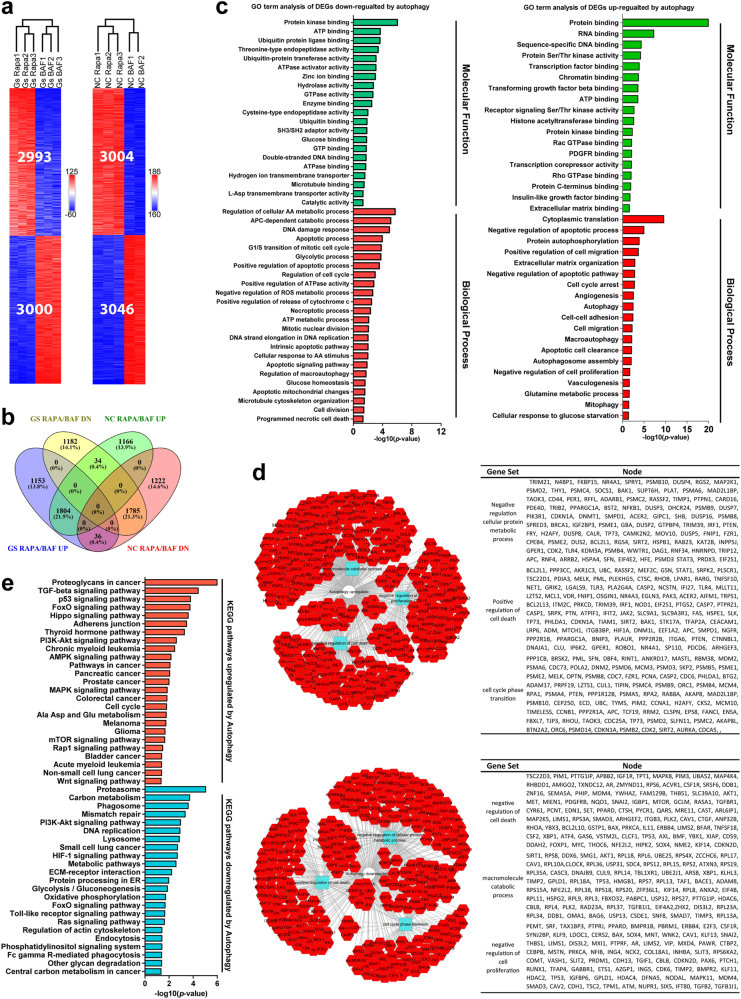
Fig. 5. Key genes and pathways regulated by autophagy in glioblastoma.
a Clustering analyses revealed differentially expressed genes (DEGs) between the experimental groups with different autophagy manipulations. Under normal condition, there were 3004 genes upregulated and 3046 genes downregulated by autophagy. Under glucose starvation condition, there were 2993 genes upregulated and 3000 genes downregulated by autophagy. b A total of 1804 genes were upregulated and 1785 were downregulated significantly by autophagy under both normal and glucose starvation conditions. c Gene ontology analysis of autophagy-regulated genes revealed many important processes related to cell metabolism/autophagy, cell cycle, death and survival etc., consistent with the phenotypical changes. d PPI network analysis revealed that the most upregulated modules were related to macromolecule catabolic process, negative regulation of cell proliferation and negative regulation of cell death and the downregulated modules consisted of those related to negative regulation of cellular protein metabolic process, positive regulation of cell death and cell cycle phase transition. e KEGG pathway analysis revealed that DEGs altered by autophagy were enriched in cell metabolism, DNA replication, cell growth, and cell cycle as well as cancer-related pathways

