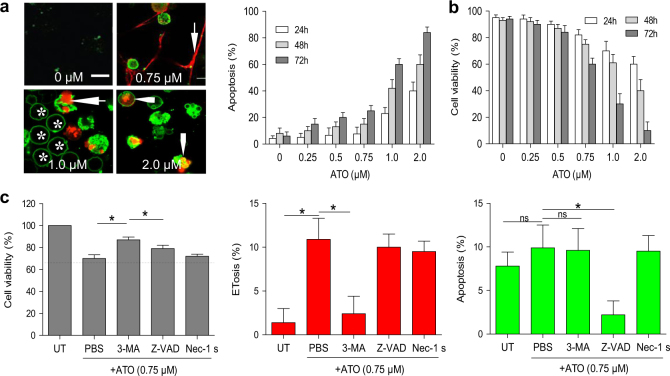
Fig. 2. ATO induces ETotic cell death in NB4 cells.
a NB4 cells were treated with 0 (PBS), 0.25, 0.5, 0.75, 1.0, or 2.0 μM ATO for 48 h and then stained with lactadherin (green) and PI (red). Confocal microscopy images showed that untreated NB4 cells showed little staining with either lactadherin or PI. The nuclei of ET-releasing cells spread into the extracellular space (arrow). NB4 cells undergoing early apoptosis showed ring-like staining by lactadherin but no PI staining (*). Cells in late apoptosis had nuclei that were condensed and staining by both lactadherin and PI (arrowhead). Apoptosis was determined by lactadherin/PI staining for 15 min at room temperature analyzed by flow cytometry. The data represents mean ± SD of three independent experiments done in duplicate. b Cell viability was detected by trypan blue exclusion. The data show mean ± SD of three independent experiments done in duplicate (n = 3). c NB4 cells were preincubated with corresponding cell death inhibitors (Z-VAD, Nec-1, 3-MA) for 1 h, and treated with 0.75 μM ATO for 48 h. The cell viability in untreated group was counted as 100%. Apoptosis was analyzed by flow cytometry and ETosis were counted as described in methods (n = 5). All values are mean ± SD. *P < 0.05, ns = not significant. Bars represent 10 μm in a

