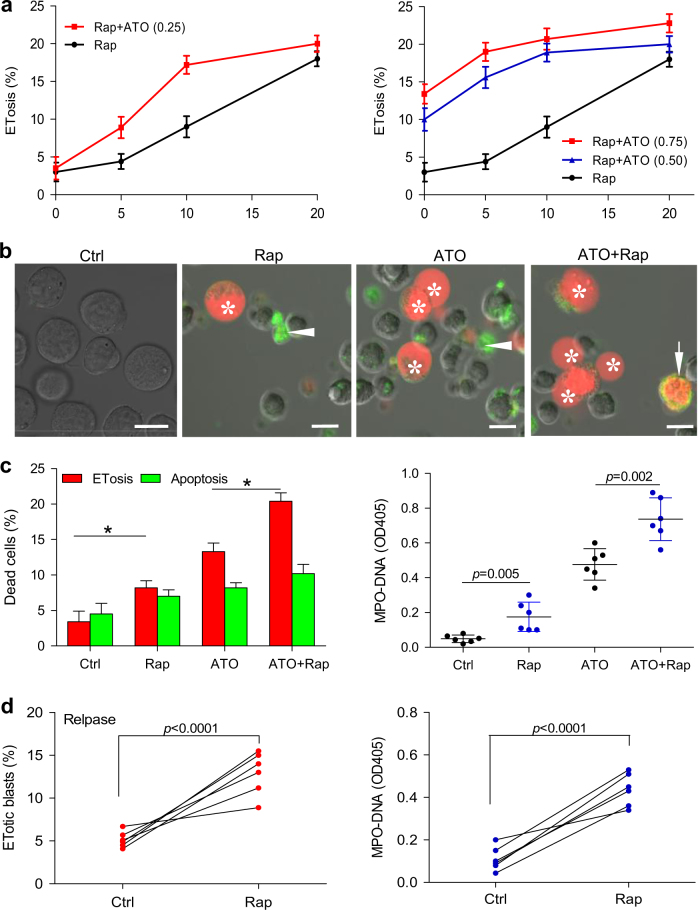
Fig. 5. Effects of ATO and rapamycin on apoptosis and ETosis in NB4 cells and patient APL cells.
a ETosis induced by low doses of ATO (0.25, 0.5, 0.75 μM) and increasing concentrations of rapamycin (0, 5, 10, and 20 nM) was evaluated at 48 h in NB4 cells. Values are expressed as mean ± SD (n = 6). b, c APL cells from newly diagnosed APL patients were treated with vehicle or rapamycin (10 nM) in the presence or absence of ATO (0.75 μM) for 48 h. b APL cells were stained with lactadherin (green) and PI (red) and imaged with confocal microscopy. ETotic cells showed nuclei (stained with PI) that had lost shape and expanded to fill most of the cytoplasm, but did not stain with lactadherin (*). In contrast, cells undergoing early apoptosis showed diffuse rim staining by lactadherin but no PI staining (arrowhead). Late apoptotic cells had condensed nuclei and were stained by both lactadherin and PI (arrow). c Cells undergoing ETosis or apoptosis were counted as described in methods (n = 6). MPO–DNA complexes levels were also measured (n = 6), *P < 0.05. d Primary APL cells from patients at relapse were treated with vehicle or rapamycin (10 nM) in the presence of ATO (0.75 μM, 48 h). The percentage of ET-formation blasts and MPO–DNA complexes in the supernatant were assayed in duplicate wells (n = 6). Bars represent 15 μm in a. Rap rapamycin

