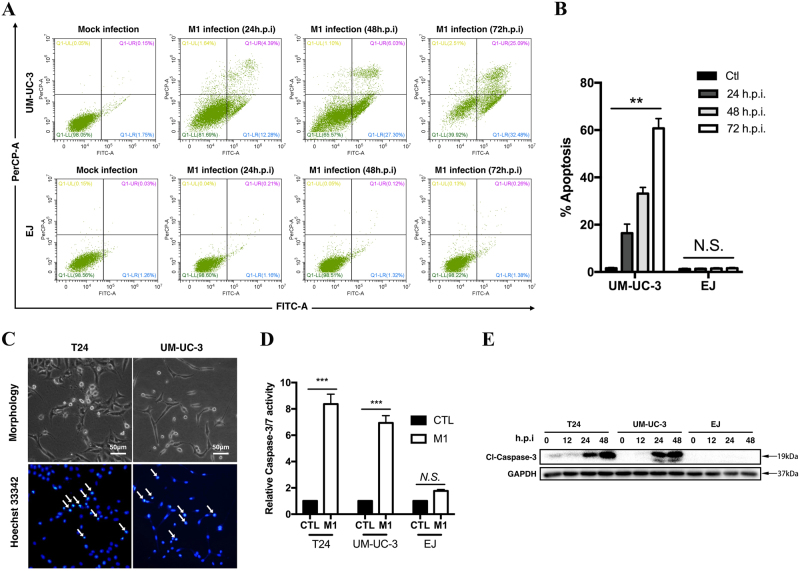
Fig. 2. M1 increases apoptosis in susceptible bladder cancer cells.
a Flow cytometry and annexin V staining analyses of UM-UC-3 and EJ cells treated with M1 (MOI = 1 PFU per cell) and mock control agents. b Numbers of apoptotic cells, as determined by flow cytometry at 24, 48, and 72 h post-infection. c Chromatin condensation was demonstrated via Hoechst 33342 staining. T24 and UM-UC-3 cells were treated with M1 (MOI = 10 PFU per cell) for 72 h. Chromatin condensation is indicated by the white arrows. d Caspase-3/7 activity in T24, UM-UC-3, and EJ cells treated with M1 (MOI = 10 PFU per cell) for 48 h. e Western blots was performed to detect caspase-3 protein expression in the indicated cell lines at 0, 12, 24, and 48 h after M1 (MOI = 10) infection. GAPDH glyceraldehyde-3-phosphate dehydrogenase, CTL control; hpi, hours post-infection. **p < 0.01; ***p < 0.001; N.S., not significant

