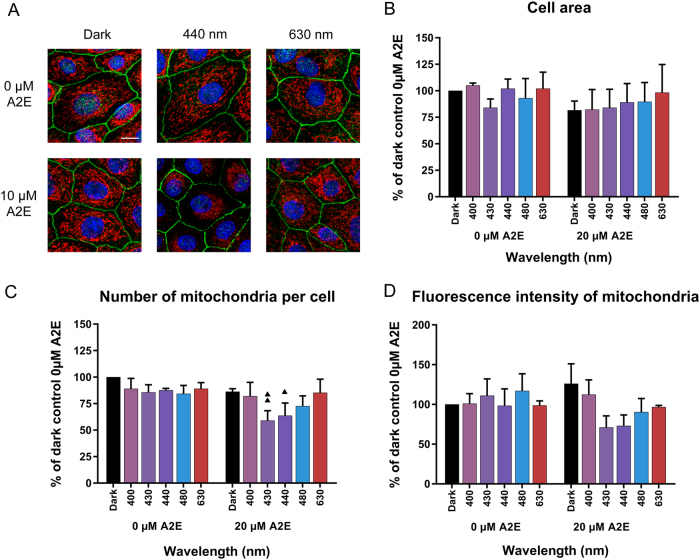
Fig. 2. Impact of light on mitochondria in A2E-loaded RPE cells.
a Confocal images of RPE cells exposed to A2E and light (440 nm and 630 nm) showing changes in mitochondrial distribution at 440 nm. Mitochondria were immunostained with an anti-ATP synthase antibody, tight junctions with an anti-ZO-1 antibody, nuclei were counter-stained with DAPI and images were acquired using confocal microscopy. Scale bar represents 10 µm. Quantification of the cell area b, the number of mitochondria per cell c and the cell mitochondrial fluorescence intensity d using the ‘Cell’ module of Imaris software. n = 3. Differences between samples and dark controls were considered to be significant when p < 0.05 (▲/*), p < 0.01 (▲▲/**), or p < 0.001 (▲▲▲/***). Triangles (▲) refer to the difference with the untreated dark control and stars (*) to A2E-treated dark control. Each 10 nm spectral band is designated by its central wavelength

