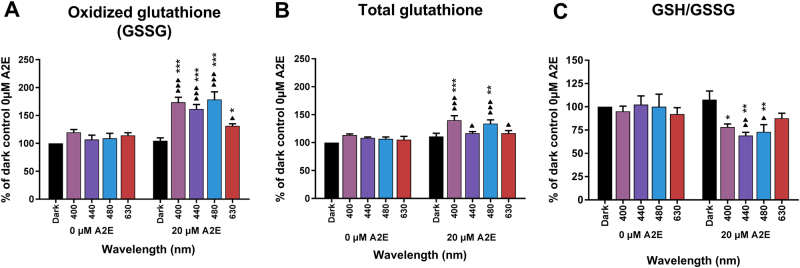
Fig. 7. Total, oxidized, and reduced glutathione levels in light-exposed RPE cells.
Oxidized (GSSG, a) and total glutathione levels b were measured in A2E-loaded cells after a 15-h light exposure. Glutathione ratios (GSH/GSSG, c) were calculated according to the manufacturer’s instructions. n = 3. Differences between samples and dark controls were considered to be significant when p < 0.05 (▲/*), p < 0.01 (▲▲/**), or p < 0.001 (▲▲▲/***). Triangles (▲) refer to the difference with the untreated dark control and stars (*) to A2E-treated dark control. Each 10 nm spectral band is designated by its central wavelength

